 Victoria Bazir

⬤ The NASDAQ US100 pulled back sharply from 25,250 down to the 24,600 zone before catching a bid. The index bounced off the 24,620 level and has since been grinding sideways in the 24,800–24,900 range, still capped by a short-term downtrend line.
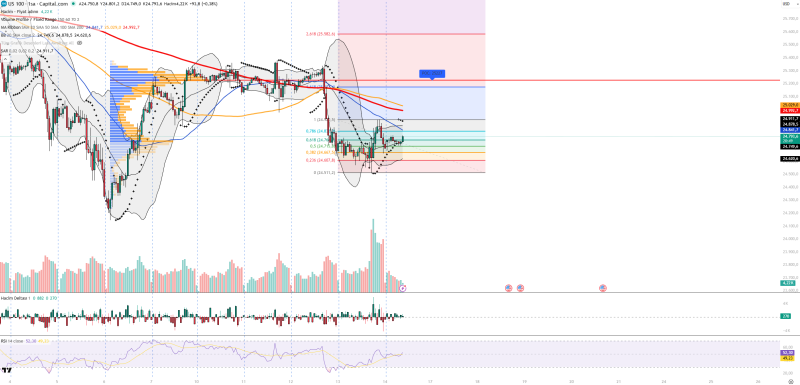
⬤ Technical signals are showing signs of stabilization rather than a full-blown reversal. The RSI is hovering around 52—a neutral-to-mildly bullish reading that fits with a corrective bounce. Price has climbed back from the lower Bollinger Band toward the middle band, while the Parabolic SAR has shifted below the price action, confirming near-term upside momentum. This type of recovery after a pullback mirrors what happened when US100 holding the 24.6K support zone managed to stabilize.
⬤ Support levels are stacked at 24,793, 24,715, and 24,607, while resistance sits at 24,900, 25,029, and the volume point of control near 25,227. The sideways grind below resistance is reminiscent of earlier periods when the index chopped around before eventually breaking through, similar to what we saw during an extended NASDAQ consolidation before resistance break.
⬤ What happens next largely depends on Fed rate expectations, bond yields, and how mega-cap tech stocks—especially AI names—perform in upcoming earnings. These macro factors have been driving sentiment across equities, much like when bond markets priced in Fed rate cuts affecting equities earlier this year.
 Victoria Bazir


