Usman Salis
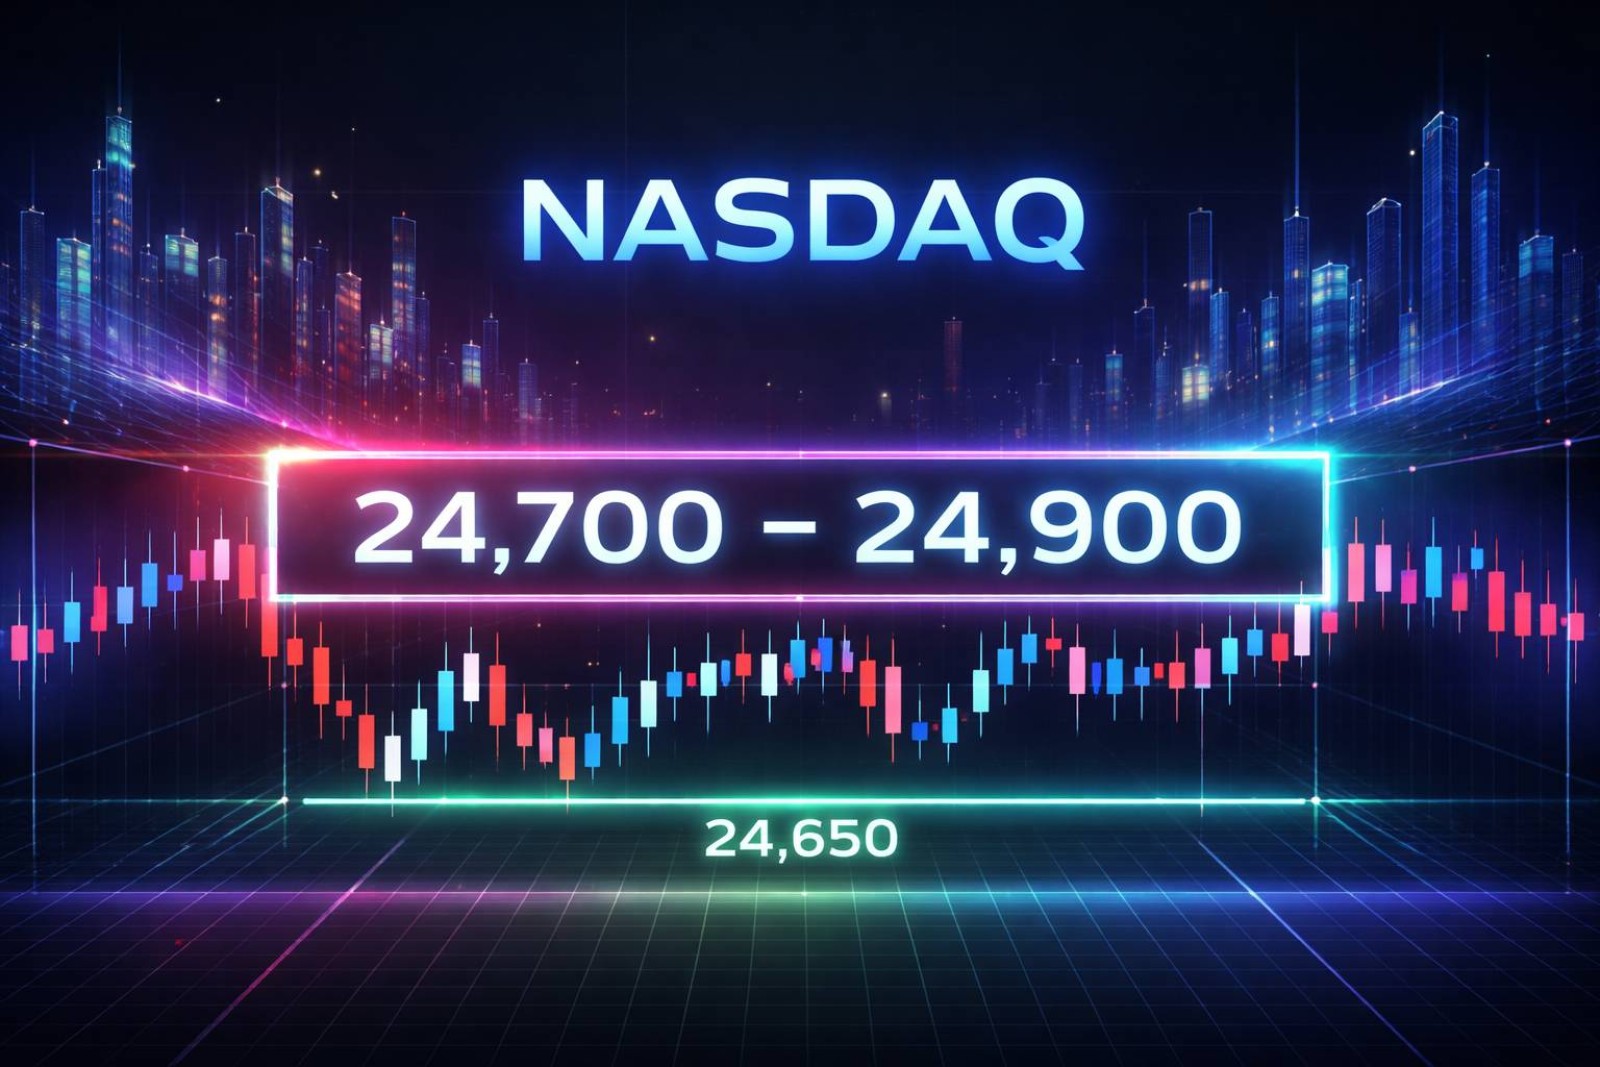
⬤ US100 has been grinding inside a tight 24,700–24,900 band on the 1-hour chart, with price bouncing around the 24,790 area and no real breakout forming yet. 24,650 is the level to watch on the downside, while 24,900 and 25,050 continue to cap any recovery attempts. This looks a lot like what happened when the index was Nasdaq holding near the 24,800 balance zone, where price simply stalled and waited for a catalyst.
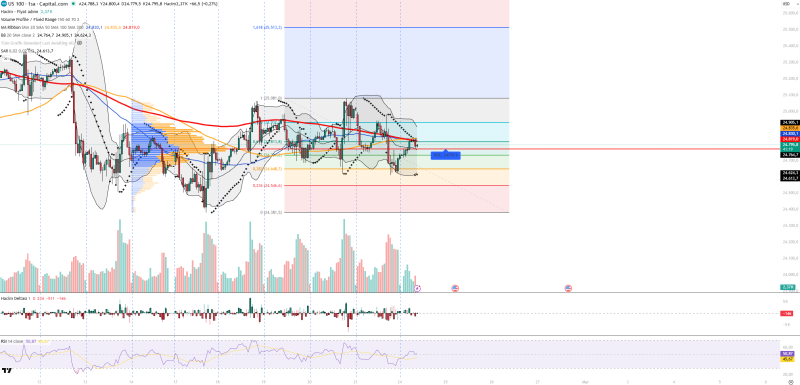
⬤ The chart tells a pretty clear story: this is a sideways market. Bollinger Bands are squeezing tighter, which usually means a bigger move is building. Parabolic SAR dots are sitting above price, adding a bit of bearish tilt, and RSI is floating between 45 and 50 — not weak, not strong, just stuck in the middle. These are classic signs of compression patterns forming ahead of a volatility breakout, where the market coils before picking a direction.
⬤ Volume is light, with neither bulls nor bears showing much conviction. The Volume Profile places the Point of Control near 24,770, which lines up with where price keeps gravitating — another sign of equilibrium. The setup mirrors earlier episodes of price stalling just under the 25,000 resistance cluster, where upside attempts kept running out of steam until a real breakout finally arrived.
⬤ On the macro side, Nasdaq remains tied to U.S. Treasury yields and Federal Reserve rate expectations. Strong economic data could push rate-cut hopes further out and weigh on growth stocks, while softer yields would offer some relief. Until the index breaks cleanly above 24,900 or loses 24,650, the short-term bias stays firmly in wait-and-see mode.
 Usman Salis