 Saad Ullah

⬤ Looking back at S&P 500 ETF's performance in 2002 gives us a fascinating glimpse into how markets behave during serious downturns. That year stands out as one of the most challenging trading environments in recent memory, yet it still offered two compelling long entry opportunities late in the year where the index surged roughly 20 percent in short bursts.
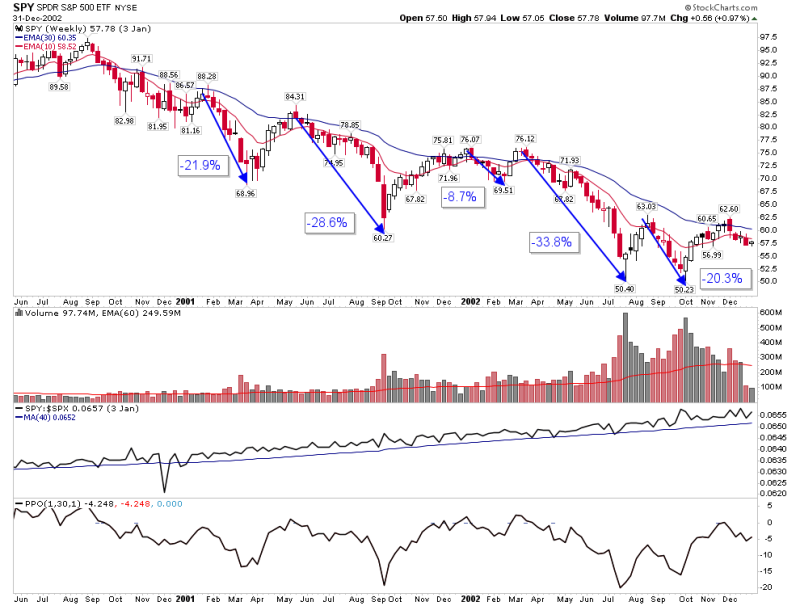
⬤ The chart from that period tells a story of relentless pressure interrupted by hope. Price action carved out a persistent downward trend with repeated selloffs, yet each decline eventually gave way to notable rebounds. The market spent months grinding lower through multiple declining phases before finally finding some stability as the year wound down. What emerged was a trading environment defined more by whiplash volatility than any clear direction—a landscape where sharp recoveries could suddenly appear within an otherwise bearish framework.
⬤ Those late-2002 rallies in SPY came fast and fierce after the index touched new lows. The percentage gains accumulated over surprisingly brief time windows, catching many off guard. What made these moves particularly interesting was that they developed while the broader trend remained unmistakably downward, showing how countertrend momentum can build real strength even during extended declines.
2002 was one of the most difficult trading environments in decades, yet it still provided two long entry opportunities where the S&P 500 advanced roughly 20 percent.
⬤ The takeaway from this historical pattern is straightforward but important: S&P 500 bear markets don't move in straight lines. Even during prolonged downturns, the market generates sizable upward moves that reflect alternating cycles of selling exhaustion and recovery momentum coexisting within the same difficult environment.
 Saad Ullah


