 Marina Lyubimova

⬤ Gold (XAU) has been climbing inside a well-defined rising channel since October 2023, steadily pushing toward the $5,000 level. The weekly chart confirms a clean series of higher highs and higher lows, with price recently approaching the channel's upper boundary before entering a mild pause. The structure remains intact, and the bullish trend in gold shows no signs of breaking down as buyers continue defending key support zones.
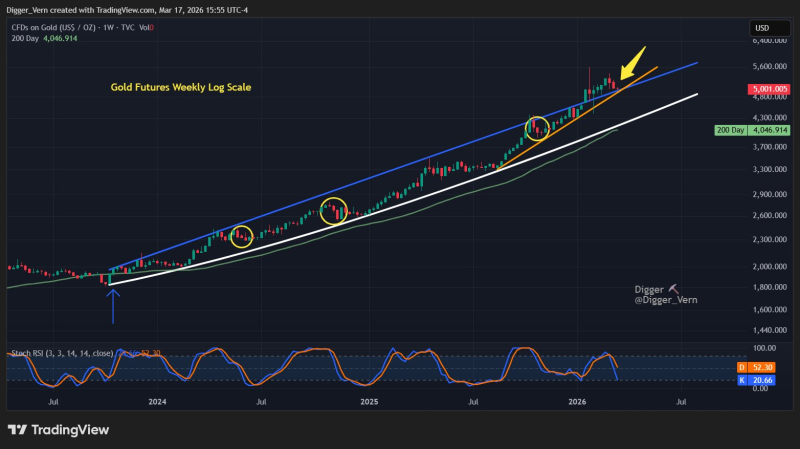
⬤ One of the most telling features of this rally is how shallow the pullbacks have been. Throughout the entire uptrend, there have been no more than three consecutive bearish weekly candles at any point. That kind of discipline from buyers suggests strong underlying demand rather than a speculative run. Corrections have been brief, and dip-buyers have consistently stepped in near trendline support, preventing any deeper unwind.
⬤ The technical picture is anchored by two key trendlines: a long-term base trendline and a steeper acceleration line that developed as momentum picked up. Price is currently sitting near the upper portion of this channel, with recent candles showing some hesitation around the $5,000 zone. This type of compression near key levels often precedes the next directional move. Analysts tracking the setup note that a triangle breakout pattern in gold could target $7,000 by mid-May if momentum holds.
⬤ Looking ahead, the pattern of limited consecutive red weeks remains the key thing to watch. As long as corrections stay shallow and the channel holds, the bullish case stays alive. A broader analysis of gold price targets suggests XAU could reach $7,000-$8,000 by May 2026 under a breakout scenario. Any shift toward deeper, prolonged selling would be the first real warning that this trend is changing character.
 Marina Lyubimova


