Marina Lyubimova

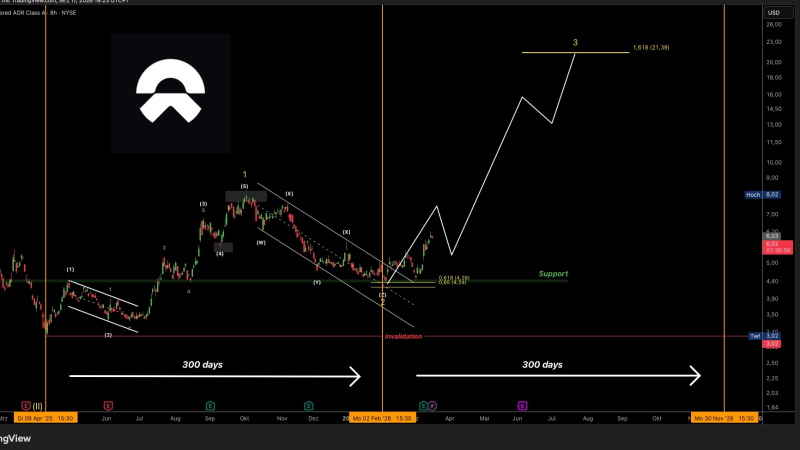
NIO stock is back on traders' radar as technical analysis flags a developing Elliott Wave pattern with a projected upside target of $21. After bottoming near $4.2 to $4.4, the stock has climbed toward the $6 level, and chart watchers say the structure points to a Wave 3 advance, historically the most powerful phase in any wave cycle.
Wave 3 Structure Points to $21 With 1.618 Fibonacci Extension
The technical framework suggests Wave 1 previously unfolded over roughly 300 days before a corrective pullback. Based on that pattern, Wave 3 could run a similar course, with a potential completion window stretching through late 2026, though analysts consider a 2027 timeline equally plausible. The upside target near NIO Elliott Wave structure eyes $12.43 represents an intermediate milestone on that path, aligned with the 1.618 Fibonacci extension level.
Elliott Wave projections are inherently uncertain and require confirmation as price action evolves.
A key invalidation level sits near $3.02. A confirmed break below that mark would undermine the bullish count and force a reassessment of the broader structure. Until that level is tested, however, the setup remains technically intact.
Prior Recovery Patterns in NIO Support the Bullish Wave Count
This is not the first time NIO has shown wave-driven momentum after an extended decline. Earlier setups tracking NIO stock prepares for next rally toward $13 and NIO stock targets $11 as momentum builds both emerged from similar accumulation phases at depressed price levels. Each of those structures reinforced how wave-based analysis can identify trend continuation potential well before price breaks out.
The current setup follows the same logic. Support zones, wave progression, and confirmation signals are the variables to watch as NIO works through what could be a multi-month advance. The $21 target remains conditional, but the technical foundation building from the $4 base gives the bullish case a credible framework heading into 2026 and beyond.
 Marina Lyubimova