 Saad Ullah

⬤ The US Dollar Index has entered a clear downside phase after failing to hold above a major resistance zone near the 100 level and breaking below its rising trendline on the daily chart. The greenback was rejected at resistance before accelerating lower, confirming a technical breakdown after weeks of consolidation. The chart highlights how DXY lost upward momentum following multiple unsuccessful attempts to reclaim higher levels.
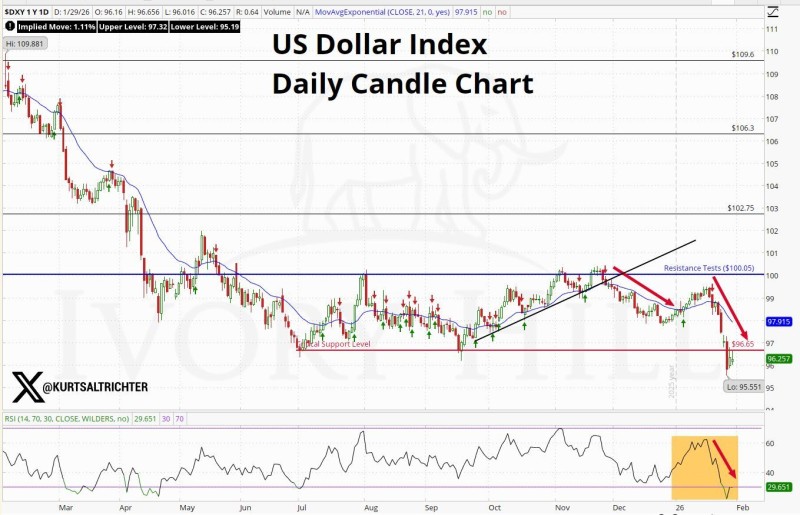
⬤ Price action shows DXY slipping below short-term moving averages and decisively breaking trend support that had been in place since early autumn. The index has now moved toward the lower portion of its recent range, with price trading near the 96.25 to 96.65 area—an important support zone. Momentum indicators reinforce this move, as the relative strength index has dropped toward oversold territory, signaling sustained downside pressure rather than a temporary pullback.
⬤ The failure at resistance and subsequent breakdown suggest sellers have regained control of the US Dollar Index. The daily candle structure reflects a decisive rejection from resistance, while the loss of trend support confirms that the prior bullish structure has been invalidated. This breakdown has increased downside momentum significantly.
⬤ A softer DXY matters for global markets due to its influence across multiple asset classes. A weakening dollar typically reduces pressure on growth stocks, supports commodities priced in dollars, and benefits emerging market currencies. It can also ease financial conditions more broadly, influencing risk sentiment across equities, foreign exchange, and commodities. With DXY now trading below key technical levels, its next moves will remain an important signal for broader market direction.
 Saad Ullah


