 Saad Ullah
⬤ There's a growing gap between what Americans are actually paying for goods and what official numbers suggest. Truflation's real-time tracking puts US headline inflation at 0.93% year over year, well below the 1% threshold. The platform calculates this daily using millions of price points collected from retailers, service providers, and suppliers across the country.
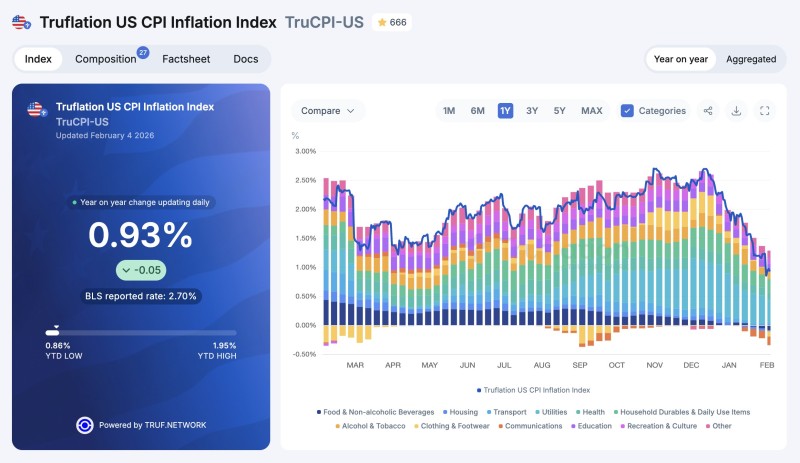
⬤ When you break it down further, core inflation (without food and energy) sits at 1.29%. Goods prices are up just 0.72%, while services inflation runs at 1.05%. What's particularly interesting is that several product categories have already flipped into deflation—meaning prices are actually falling, not just rising more slowly.
⬤ Compare that to the Bureau of Labor Statistics' latest official report showing headline CPI at 2.7% for December. That's nearly three times higher. The difference comes down to method: traditional CPI relies on monthly surveys, while Truflation uses continuous real-time pricing data. Historically, Truflation's readings have signaled trends before they show up in official reports.
⬤ For markets, this matters. A lot. Inflation expectations drive everything from Fed policy decisions to bond yields to stock valuations. If inflation is actually running below 1% as Truflation suggests, that tells a very different story than the official 2.7% figure. Traders and investors are starting to pay closer attention to real-time indicators like this, viewing them as early warning systems for shifts in the economy that won't show up in government data for weeks or months.
 Saad Ullah


