 Usman Salis
⬤ TruFlation's daily-updated US CPI index registered just 0.72% year-over-year on February 13, 2026, creating a stark contrast with the Bureau of Labor Statistics' official reading of 2.70% displayed on the same dashboard. The gap between these two measures highlights how real-time economic data can paint a very different picture than traditional monthly government reports.
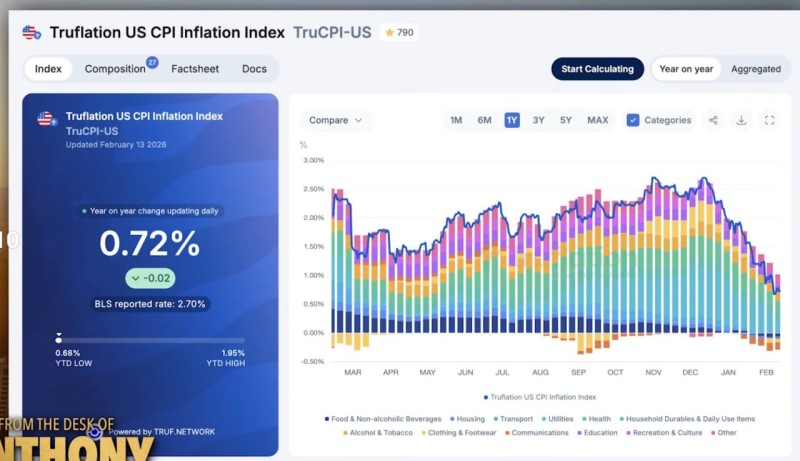
⬤ The dashboard screenshot reveals a one-year trend with clear category breakdowns and a sharp decline from late 2025 levels into early February. TruFlation markets itself as a faster alternative to standard CPI tracking, updating daily rather than waiting for monthly government releases. This 200-basis-point spread has become a recurring theme in recent economic coverage, including Independent data shows US CPI at 0.72%.
⬤ As one observer noted, the 0.72% reading looks "ice cold" compared to the official numbers—a description that captures just how dramatic this divergence has become. The timing and magnitude of this gap raises questions about where inflation actually stands right now versus where government statistics say it was last month. Similar analysis appears in coverage of US inflation gap hits 200 basis points.
⬤ This split between real-time and official inflation measures carries real consequences for markets. When alternative trackers consistently run below official CPI, traders start adjusting their expectations for Federal Reserve policy—sometimes well before the next CPI report confirms any actual shift. Inflation expectations drive rate expectations, which in turn influence everything from bond yields to stock valuations. That dynamic is explored further in Fed rate cut expectations grow as markets price in faster easing—where the conversation has already moved toward timing potential policy changes even as official data lags behind.
 Usman Salis


