 Marina Lyubimova
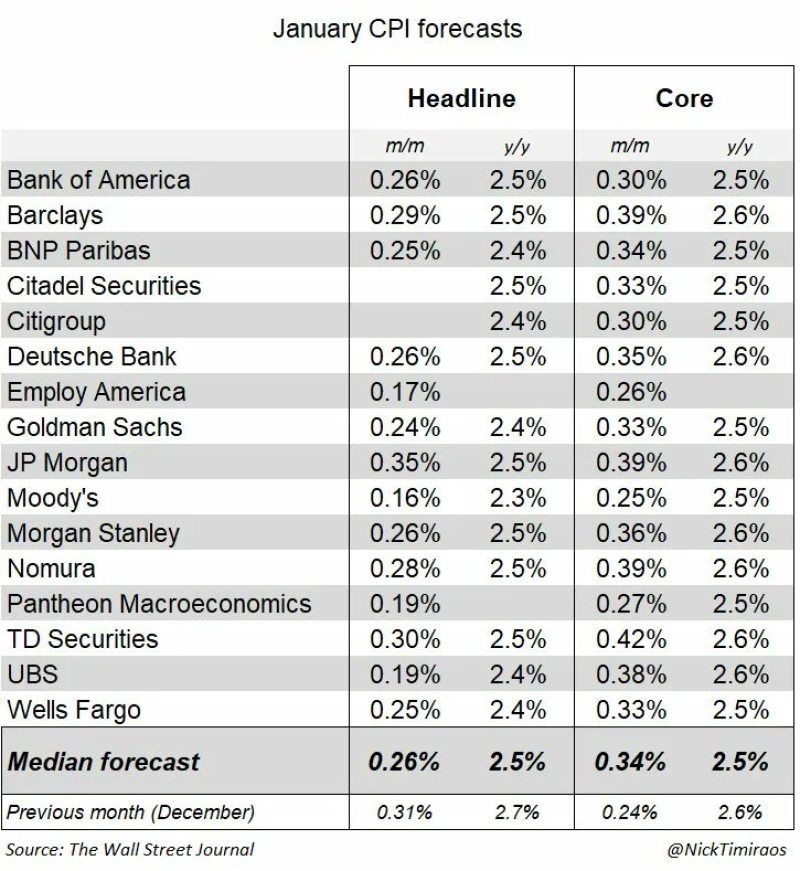
While Wall Street economists predict January's official inflation number will hover around 2.4% to 2.5%, independent real-time price tracking tells a dramatically different story. The gap between alternative data and government statistics has widened once again, raising questions about how quickly inflation is actually cooling in the American economy.
Real-Time Tracking Shows 0.72% Inflation Rate
According to Truflation, an independent inflation monitoring platform, the current US Consumer Price Index stands at just 0.72% on a year-over-year basis. That's a stark contrast to December's official reading of 2.7% from the Bureau of Labor Statistics, which is set to release January's headline number along with updated category weights for 2026.
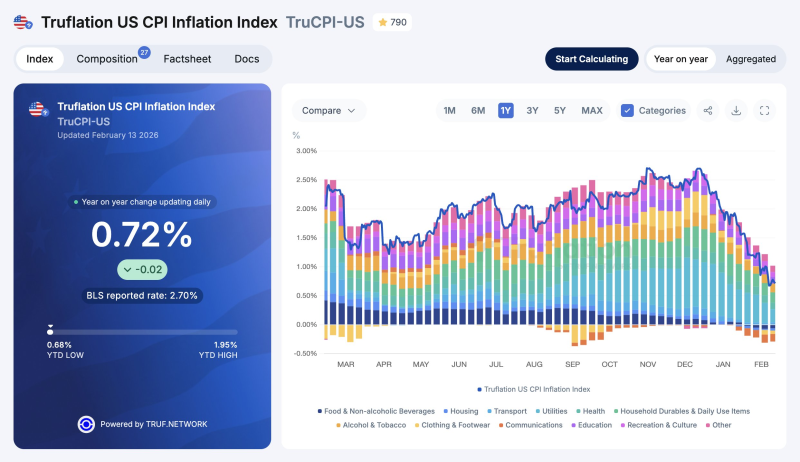
The institutional forecast range spans from 2.3% to 2.7%, with most economists clustering their predictions between 2.4% and 2.5%. However, when real-time price trends are mapped to official methodology, the independent estimate suggests the actual result could land somewhere between 2.2% and 2.4%.
The difference between real-time tracking and official statistics continues to highlight significant variations in how inflation is measured and reported, according to Truflation's methodology documentation.
This isn't the first time alternative data has shown lower readings. Previous reports documented similar patterns in US Inflation Falls to 0.98% According to Truflation Real-Time Data and US CPI Inflation Drops to 0.86% on Feb 1.
Revised CPI Weights Could Shift the Picture
Beyond the headline number, market participants are paying close attention to the Bureau of Labor Statistics' revised CPI weights. These adjustments determine how much influence housing, transportation, food, and services have on the overall inflation calculation. The independent dataset points to broader cooling across most price categories, even as the economist consensus remains anchored near 2.5%.
Why This Matters for Markets and Policy
Inflation expectations drive decision-making across macro-sensitive assets, from commodities like gold to interest rate futures. A reading toward the lower end of forecasts would confirm that price pressures are easing faster than official data previously indicated. Conversely, a number closer to 2.5% would suggest inflation remains stubborn near recent levels.
The final figure, combined with methodology adjustments, will shape how investors and policymakers interpret the inflation trajectory over the coming months and influence expectations around future economic conditions.
 Marina Lyubimova


