 Saad Ullah

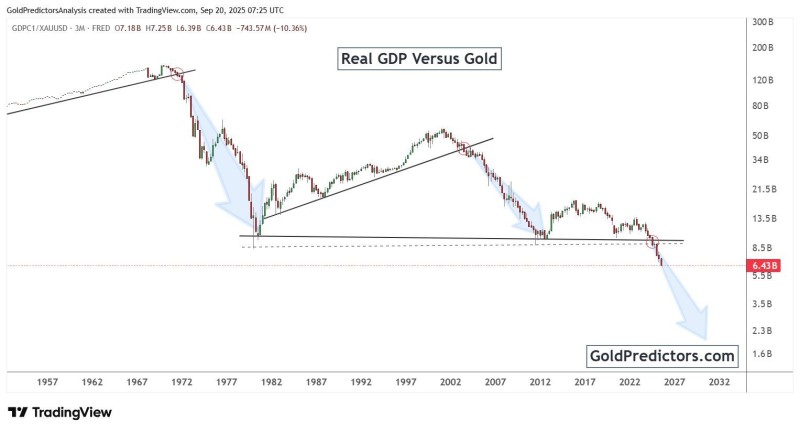
The GDP-to-Gold ratio has just experienced a historic breakdown, falling to 6.43B after breaching crucial long-term support levels. This metric, which measures real economic output against gold's performance, is flashing the same warning signals we saw during two of the most turbulent economic periods in recent history: the inflationary 1970s and the lead-up to the 2008 financial crisis.
What the Charts Are Telling Us
The data reveals two striking historical precedents that mirror today's situation. During the 1970s decline, when the U.S. abandoned the gold standard, inflation exploded while GDP growth stagnated, sending gold prices soaring relative to economic output. The 2000s saw a similar pattern, with gold surging ahead of the global financial meltdown while GDP lagged behind. Now in 2025, we're witnessing the ratio crash below its 8.5B support level to 6.43B, suggesting markets are once again betting on gold over economic expansion.
Key Technical Signals
- Support breakdown confirmed: The breach of long-term support at 8.5B represents a decisive bearish signal
- Downside projection: Technical analysis points toward potential targets of 5.5B to 3.5B, matching historical cycle lows
- Trend persistence: The downtrend established in 2012 remains firmly in control
What's Driving This Shift
Several powerful forces are converging to create this environment. Inflation continues to pressure economies despite aggressive central bank tightening cycles, while global GDP growth struggles under massive debt burdens accumulated over the past decade. Central banks worldwide are accumulating gold at record levels, signaling institutional skepticism about fiat currencies. Meanwhile, escalating geopolitical tensions are reinforcing gold's traditional role as the ultimate safe haven asset.
 Saad Ullah


