Peter Smith
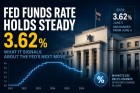
⬤ A Federal Reserve chart is drawing renewed notice for what it shows about COVID-era spending and the inflation wave that followed. The figures show that federal outlays leapt from 4.8 trillion dollars to more than 9 trillion dollars during the pandemic response, while inflation rose from under two percent to almost nine percent in the months that followed. Both numbers have stayed high squeezing household budgets plus reshaping the economic outlook for 2025.
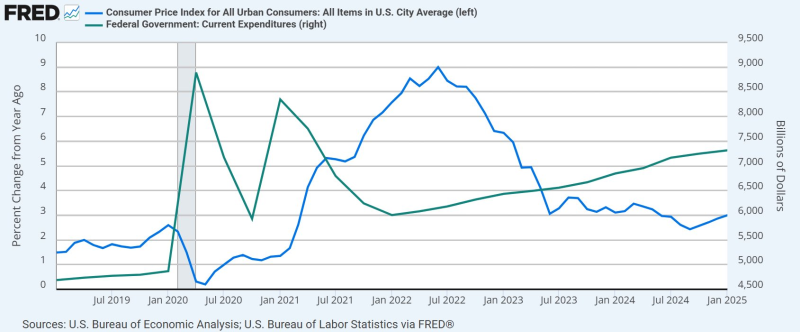
⬤ The pattern is plain. Federal outlays surged during the 2020 emergency, topped nine trillion dollars then eased - but they did not drop back to the old level. Instead they settled between six and seven trillion dollars and resumed their climb. By early 2025 the green line on the FRED chart points toward 7.3 trillion dollars. The blue inflation curve fell sharply during the first lockdowns then raced past eight percent year-over-year by mid-2021 but also stayed between three and five percent through 2023.
⬤ What is striking is that inflation never returned to its old level. Even after retreating from the 2021 peak, prices stay above the Federal Reserve's two percent target. This lasting lift means Americans face a cost-of-living setting that differs sharply from the pre-COVID world. Housing as well as routine bills all cost markedly more and the spending figures indicate that the earlier baseline will not return soon.
⬤ The two trends shape how markets or policymakers view the future. Higher outlays entail heavier government borrowing and raise doubts about long term fiscal health. Inflation that stays above the old norm touches everything from consumer confidence to investment choices. Together those forces have forged a new economic reality that is still unfolding - one in which both spending also price pressures sit structurally above the levels seen before 2020.
 Peter Smith