 Saad Ullah
● The 10-Year Treasury Yield has been making moves lately, and according to chart analyst King of the Charts, there's something interesting happening beneath the surface. Both the RSI and MACD are showing bullish divergence, which typically means one thing: the market is positioning itself for higher inflation numbers.
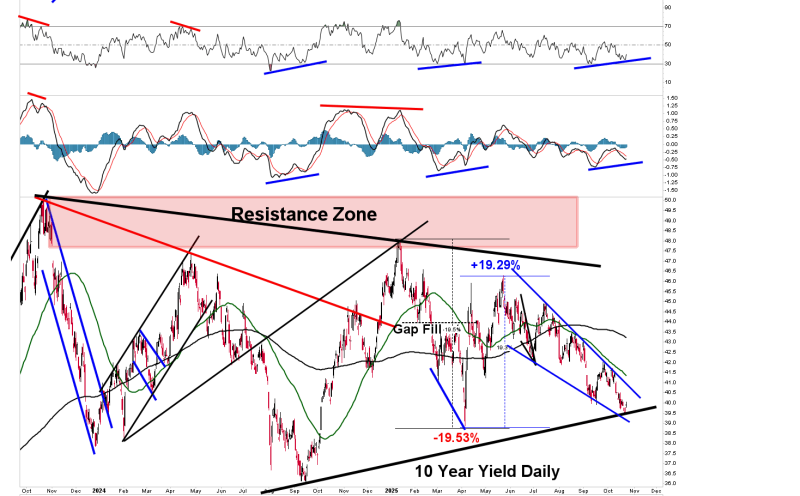
● Tomorrow's CPI report, dropping before the opening bell, is what everyone's watching. King of the Charts has been saying for a while now that inflation bottomed out and would start climbing again—and it looks like the market agrees. The rally in the 10-Year Yield, combined with these technical signals, tells us investors are getting ready for a potentially spicy inflation print.
● What does this mean for markets? Well, when yields rise like this, it usually points to concerns about tighter monetary policy down the road. That's not great news for stocks or bonds, which tend to struggle when borrowing costs creep higher. If tomorrow's CPI confirms these fears, we could see some real fireworks.
● There's also a technical pattern worth noting: the 10-Year Yield is forming what's called a bullish falling wedge. Traders who follow chart patterns know this often precedes further upside movement. With the S&P 500 hovering near all-time highs and CPI on deck, volatility could spike fast.
 Saad Ullah


