 Eseandre Mordi

After several days of consistent decline, EUR/USD finally showed real momentum on October 23. The 15-minute chart displayed a sharp bounce from a liquidity trap just under 1.1590 — a move that caught short positions off guard before flipping bullish in a quick, powerful push. This kind of price action reflects the precision trading typically seen from institutional players who capitalize on market structure inefficiencies.
Smart-Money Reversal Pattern Unfolds
Trader MR | EUR recently noted that "EUR/USD paid" — confirming the setup played out as anticipated. The chart backs this up: after briefly dipping below 1.1590, price reversed hard and rallied to 1.16146, where partial profits were taken and stops moved to breakeven.
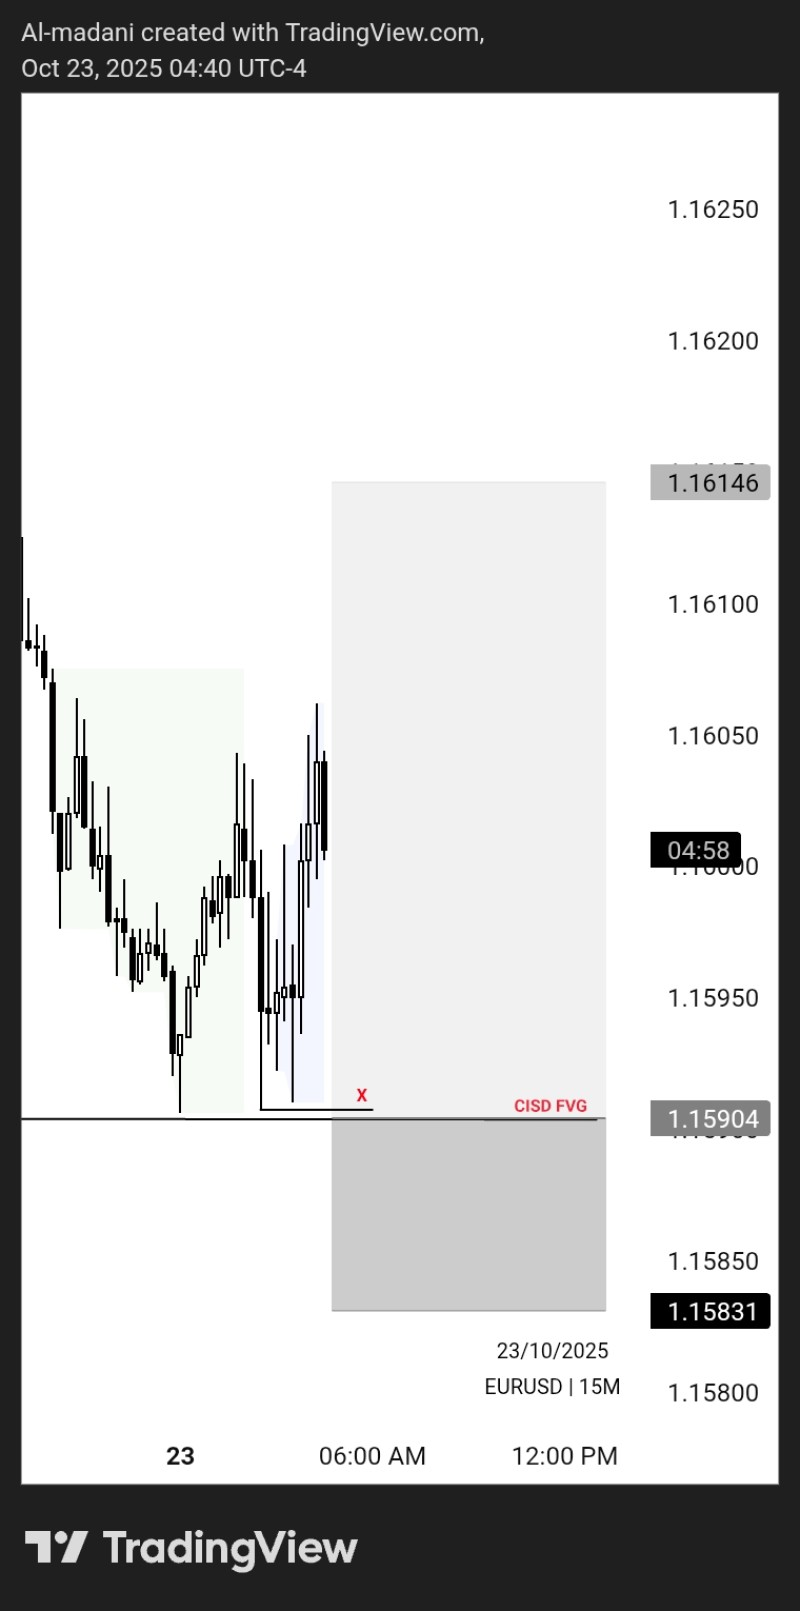
This follows a textbook smart-money concept structure: liquidity grab below key support, fill of the Fair Value Gap, and then measured upward displacement.

The shaded CISD FVG zone marked on the chart acted as both trigger and confirmation for the reversal.
Key Levels and Market Structure
The initial bearish move built a liquidity pool beneath 1.1590, pulling in short orders before the sharp reversal kicked in. Once that liquidity got absorbed (marked "X" on the chart), price reclaimed structure with strong momentum and pushed toward the 1.1614–1.1615 zone. The final chart snapshot shows this move completing cleanly, with price rejecting right at the marked resistance before settling into consolidation. This confirms a structural shift from short-term bearish to controlled bullish continuation. As long as EUR/USD holds above 1.159, the near-term outlook stays positive.
 Eseandre Mordi


