 Peter Smith

⬤ EUR/USD has cooled off after a strong push higher, settling into a tight range on the hourly chart. The pair is forming what looks like a consolidation flag after its recent climb. While price action has slowed down, the overall direction is still pointing up—this looks more like a breather than a reversal.
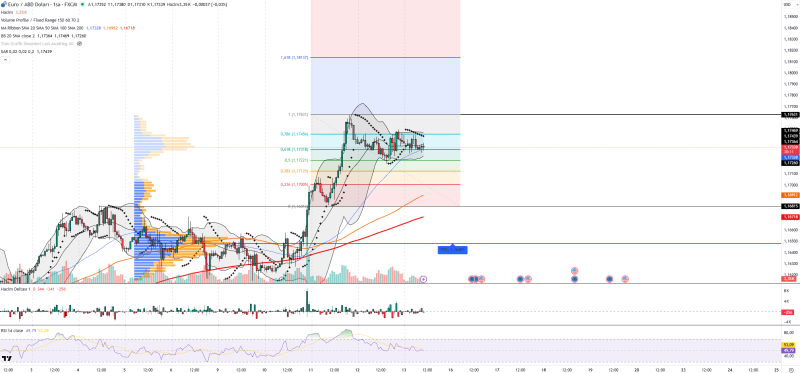
⬤ The chart shows Fibonacci levels playing a big role here. EUR/USD is holding above the 0.5 to 0.618 retracement zone, which is often where trends decide whether to continue or fade. So far, the euro is respecting that area. Support is sitting at 1.1731, 1.1722, and 1.1713, while resistance levels are marked at 1.1749, 1.1763, and 1.1813. As long as price stays above those mid-level supports, the bullish structure stays intact.
⬤ Momentum indicators back up the idea that things are just sideways for now. The RSI is hovering around 50—right in neutral territory—showing that neither buyers nor sellers have the upper hand yet. Volume has dropped off after the initial surge, which is typical when price consolidates. Bollinger Bands are squeezing tighter, a sign that volatility is compressing and a bigger move could be coming soon. Parabolic SAR dots are hugging price closely, meaning there's no clear signal yet on which way things will break. Volume Profile shows a key level around 1.165, marking a medium-term balance point below where we're trading now.
⬤ This matters for the broader forex market because EUR/USD often sets the tone for overall currency sentiment. If the euro keeps holding above these Fibonacci levels, the uptrend could stay alive and well. But if consolidation drags on, it might delay the next leg higher. Tight ranges like this usually come before sharper moves, so how this plays out will likely shape short-term expectations and volatility across major pairs.
 Peter Smith


