 Alex Dudov
⬤ EUR/USD has rallied sharply on the daily timeframe, climbing toward the previous week's high near 1.1760. The current price structure shows a critical zone where the pair might test that weekly level before potentially dropping back to fill a daily fair value gap lower down. The most recent candle signals continued buying pressure after a clean impulse higher.
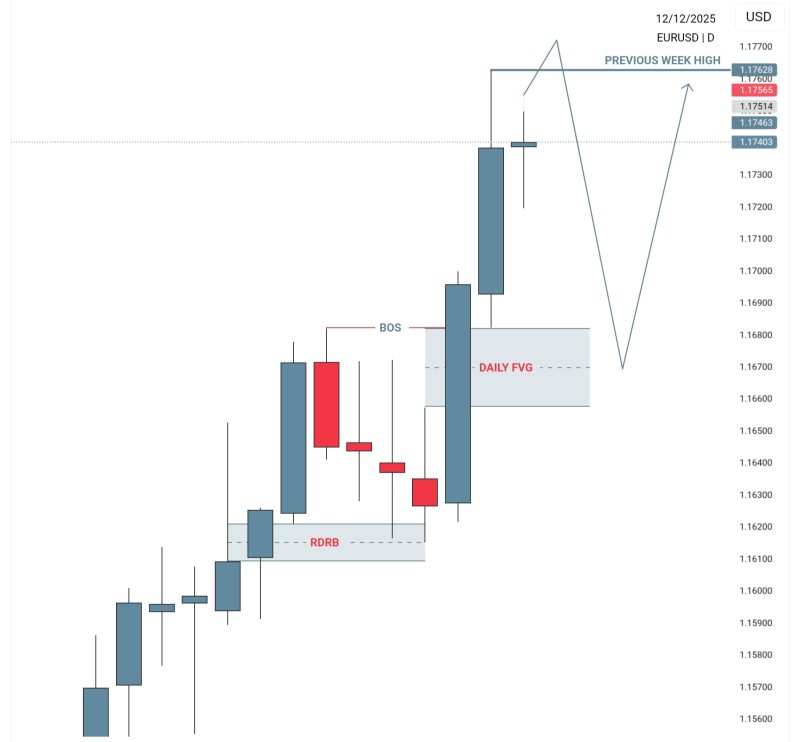
⬤ Earlier in this move, the chart marked a decisive break of market structure, followed by brief sideways action before the rally resumed. Price launched from a demand zone labeled RDRB, then posted back-to-back bullish candles that pushed EUR/USD into the upper end of its recent range. This brought the pair right into an area where liquidity has clustered in the past.
⬤ Meanwhile, there's still an unfilled daily FVG sitting below, roughly between 1.1660 and 1.1680. That creates a setup where price could either push through to the weekly high first, then retrace deeper, or reverse now to rebalance that inefficiency before making another run higher. The chart outlines both scenarios without picking a definite direction.
⬤ For FX traders, this matters because EUR/USD drives a huge chunk of global currency flows. How price handles these weekly highs and daily gaps often shapes short-term volatility and where liquidity shows up during the session. The pair's next move around these levels could set the tone for upcoming trading days as macro factors and positioning continue steering euro-dollar dynamics.
 Alex Dudov


