Peter Smith

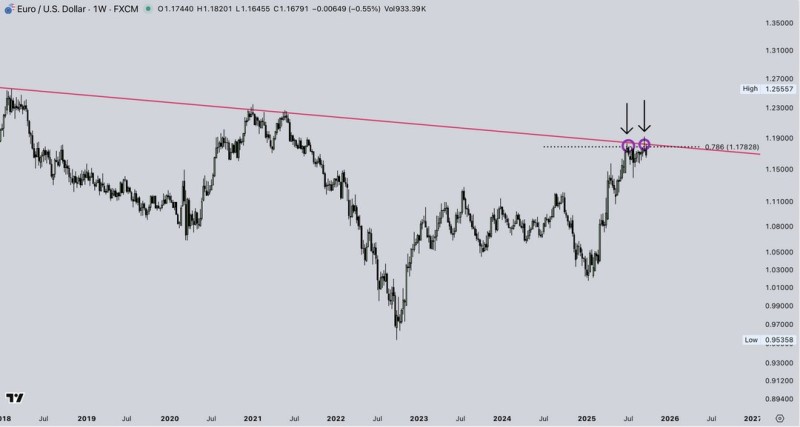
The euro has hit another major roadblock against the dollar. After climbing steadily for months, EUR/USD is now stuck at a critical resistance zone where a long-term trendline meets the 0.786 Fibonacci level around 1.18-1.19. Multiple failed breakouts and Europe's economic struggles have traders wondering if we're about to see another reversal.
Macro Picture Supports the Technicals
The fundamental backdrop aligns with what we're seeing on the charts. As noted by Luca, the ECB continues facing pressure to ramp up its easing measures. Despite rate cuts, the eurozone economy still trails other major economies, creating ongoing headwinds for the euro.
Meanwhile, while the Fed is also easing policy, their stance appears more measured compared to the ECB's approach. This policy divergence naturally favors the dollar and reinforces the technical resistance we're seeing.
Technical Setup Shows Clear Rejection
The chart reveals EUR/USD facing serious resistance in the 1.178-1.19 area. This zone combines the descending trendline from previous years with the 0.786 Fibonacci retracement - a powerful combination that has repeatedly turned the pair lower.
Key technical observations: two clear breakout failures near the trendline (marked by arrows), strong rejection candles around 1.18, and defined support levels at 1.15 with potential for deeper decline to 1.11 if selling pressure increases.
This pattern of repeated rejections suggests bears remain in control unless buyers can finally push through with conviction above the resistance zone.
Trading Scenarios
For bulls, a clean break above 1.19 would open the door to 1.22-1.25. For bears, continued failure at current levels points to a move back toward 1.15 support, with risk of extension to 1.11 if momentum accelerates.
The 1.18-1.19 zone will likely determine EUR/USD's path as we head into the final months of 2025, making it a critical level to watch for both technical and fundamental reasons.
 Peter Smith