Usman Salis
The EUR/USD is at a pivotal moment as it trades around the 1.1700 level following recent volatility. The pair's current structure suggests we could see more weakness ahead, though key support zones may provide opportunities for traders watching the charts.
EUR/USD Daily Chart Outlook
The daily chart reveals a critical phase in price action as the pair consolidates around 1.1700. According to IB-forex trader analysis, the recent structure shows a liquidity run toward 1.1850, followed by rejection at the ERL (Extreme Range Level) and a sharp decline.
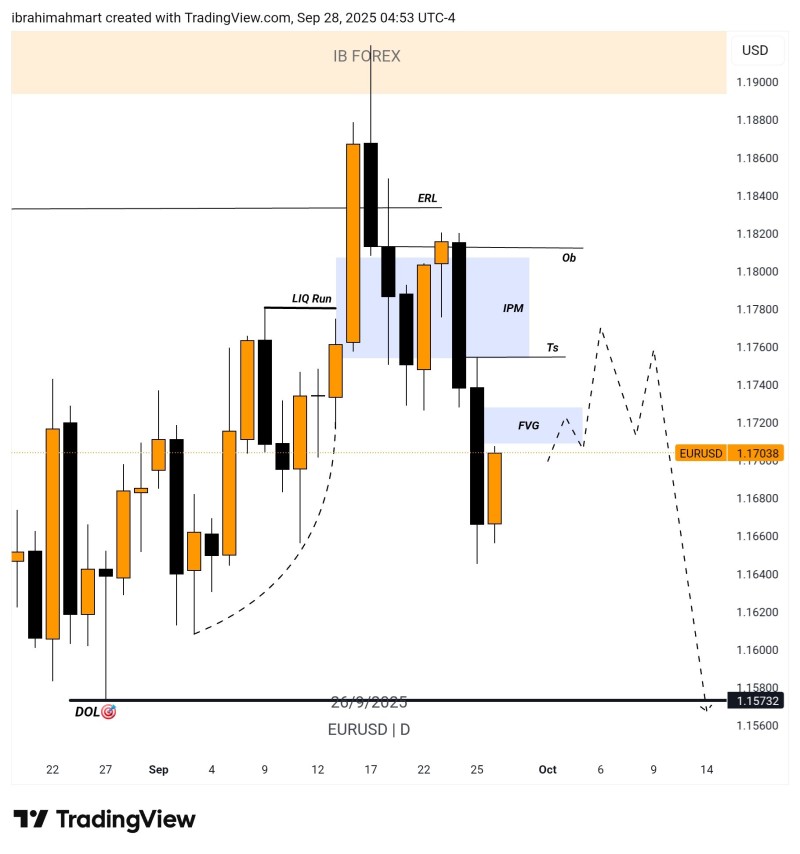
The chart also highlights a clear imbalance with an FVG (Fair Value Gap) near 1.1720, which may act as a short-term magnet for price. Below this, the 1.1573 zone emerges as the next key downside target should bearish momentum persist.
Key Technical Signals
The spike above 1.1850 suggests trapped longs, triggering a corrective wave lower through a liquidity sweep. Selling pressure was reinforced at the 1.1800–1.1820 range through an Order Block Resistance (OB), where bears regained control. Price may attempt to retest the 1.1720–1.1740 Fair Value Gap zone before the next major move, while the chart outlines 1.1573 as a deeper support area if bearish flows continue.
Why This Matters
The EUR/USD weakness reflects diverging monetary policy expectations. The U.S. Federal Reserve's cautious stance and stronger U.S. data have supported the dollar, while the European Central Bank faces pressure from sluggish eurozone growth. This macro divergence adds weight to the bearish technical setup we're seeing on the charts.
 Usman Salis