Peter Smith

ZEC is attempting a structural shift after reclaiming a major support-resistance zone on the daily chart. The move above this area signals a potential change in trend, with price now pushing higher into open space. As ChartNerd noted, maintaining levels above $325 keeps the path toward $500 intact.
The ZEC Break That Changed the Structure
The chart shows a clear transition from a prolonged downtrend into a breakout phase. Through late 2025 and early 2026, ZEC printed a sequence of lower highs and lower lows - confirming sustained bearish pressure.
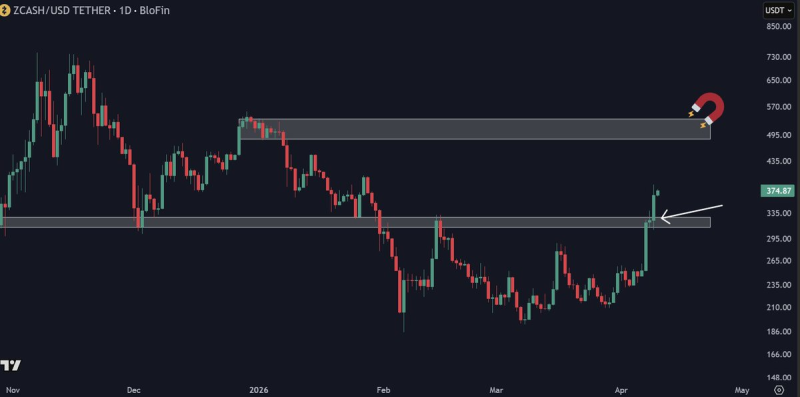
That structure began to weaken as price formed a base in the $200-$260 range before accelerating upward. The key moment came with a decisive breakout above the $300-$335 zone, which had repeatedly acted as resistance. This breakout is not marginal - it is impulsive, with strong upward candles pushing price cleanly through the level.
Why $325 Is Now the Critical ZEC Pivot
The reclaimed zone around $325 now defines the structure. Previously a resistance band, it has flipped into support - and the chart suggests that price is attempting to build above it.
The current setup depends entirely on holding this level on the daily timeframe. A sustained hold would confirm acceptance above the breakout zone, reinforcing bullish continuation. A drop back below would invalidate the move and return price to the prior range.
Zcash Halving to Reduce Issuance and Inflation in 2025 provides fundamental context for why ZEC's supply dynamics are shifting in parallel with the technical breakout - a combination of reduced issuance and a structural price shift that makes the $325 hold more meaningful than a purely technical event.
The Open ZEC Path Toward $500
Above current price, the chart shows limited resistance until the $480-$520 region. This upper zone aligns with a prior supply area and represents the next major objective. The structure suggests a clean upside path if momentum continues:
- Break and hold above the $300-$335 zone
- Establishment of $325 as support
- Expansion toward the $500 resistance region
XMR Price Analysis: Monero Breaks to New All-Time High Near $660 shows how a comparable privacy coin handled a similar structural breakout - where clearing major resistance triggered an accelerated upside phase that extended well beyond the initial breakout zone.
ZEC Momentum Builds Into a New Phase
What stands out is the clarity of the current structure. The market has moved through three distinct phases: downtrend, base formation, and breakout. Each phase is visible and well-defined on the chart - with no signals of immediate rejection at the breakout level yet.
BTC Breaks Above $69K Range, Eyes $74K Liquidity Zone reinforces how breakout structures are defining directional continuation across the broader crypto market right now, placing ZEC's move within a wider pattern of range resolutions rather than an isolated event.
As long as ZEC remains above $325 on the daily timeframe, the structure favors continuation rather than reversal. In that context, the $500 zone becomes not just a target, but the next major test of whether this breakout can evolve into a sustained upward move.
 Peter Smith