 Marina Lyubimova
XRP is setting up for what could be a major breakout as technical patterns align, with the cryptocurrency eyeing a move above stubborn $2.40 resistance toward $2.60-$2.80 levels.
XRP Price Getting Ready for Something Big
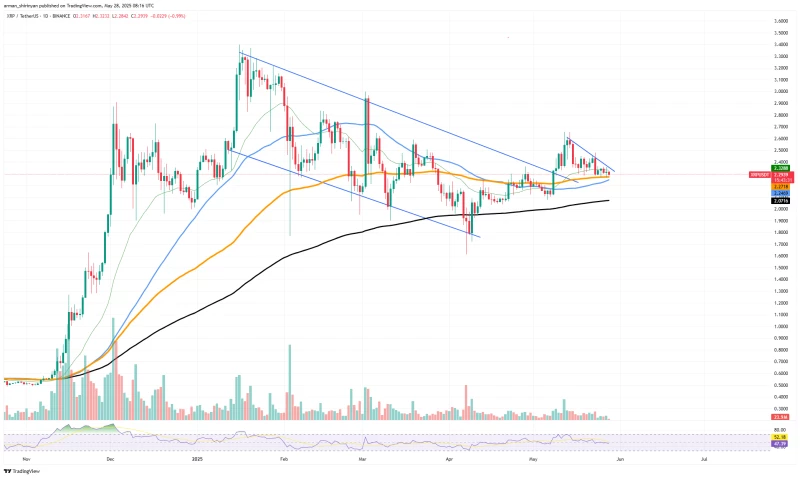
Right now, XRP is sitting pretty at around $2.29, and things are starting to look interesting from a technical standpoint. The coin's been dancing around some key moving averages - specifically the 50 EMA and 100 EMA - and they're about to do something that usually gets traders excited.
We're talking about a mini-golden cross here, which is basically when the shorter-term moving average (50 EMA) crosses above the longer one (100 EMA). It might sound like technical jargon, but this pattern has a pretty solid track record of signaling that better times might be ahead for a cryptocurrency's price.
XRP's Been Playing It Cool, But That Might Change Soon
For weeks now, XRP has been stuck in what looks like a triangle pattern - you know, one of those situations where the price keeps bouncing between tighter and tighter levels. The coin's been hanging out mostly between $2.25 and $2.40, and trading volume has been pretty quiet.
Here's the thing though: when volume drops like this during a consolidation phase, it often means the market's just taking a breather before making its next big move. And with that mini-golden cross lurking just around the corner, XRP bulls might finally get the spark they've been waiting for.
That Pesky $2.40-$2.50 Wall Keeps Getting in XRP's Way
Let's be real - XRP (XRP) has tried to break above $2.40 multiple times, and it hasn't been easy. This price zone between $2.40 and $2.50 has been like a brick wall for the cryptocurrency, turning back rallies time and time again.
But here's where it gets interesting: if XRP can actually punch through this resistance with some decent volume behind it, technical folks are eyeing $2.60 or even $2.80 as realistic next stops. Of course, if it can't break free, we might just see more of the same sideways action we've been getting lately.
XRP's Momentum Indicators Are Playing Hard to Get
The RSI (that's the Relative Strength Index for those keeping score) is sitting right around 50, which is basically the market's way of saying "meh, we're not sure yet." It's not screaming buy, but it's not flashing warning signals either.
What's actually pretty encouraging is that the 200 EMA is sitting way below where XRP is trading now. Think of it as a safety net - if things go south, there should be some solid support levels to catch any falling prices. It's like having a cushion that's gotten thicker over time.
The Bottom Line on XRP's Technical Picture
Look, XRP (XRP) is setting up for what could be a pretty significant move. The mini-golden cross formation is the kind of technical pattern that gets momentum traders excited, and if it can finally break above that stubborn $2.40-$2.50 resistance zone with some real volume, we might see the kind of rally that XRP holders have been patiently waiting for.
The triangle pattern shows that pressure is building, the moving averages are aligning nicely, and market sentiment seems to be improving. Sure, there are no guarantees in trading, but sometimes the stars align just right. For XRP, this might be one of those moments where patience finally pays off and the price makes a meaningful move higher toward those $2.60-$2.80 targets that have been on everyone's radar.
 Marina Lyubimova


