Peter Smith
Trading around $2.64, XRP's structured price action continues to attract both active traders and patient investors looking for the next major move.
Key Technical Patterns
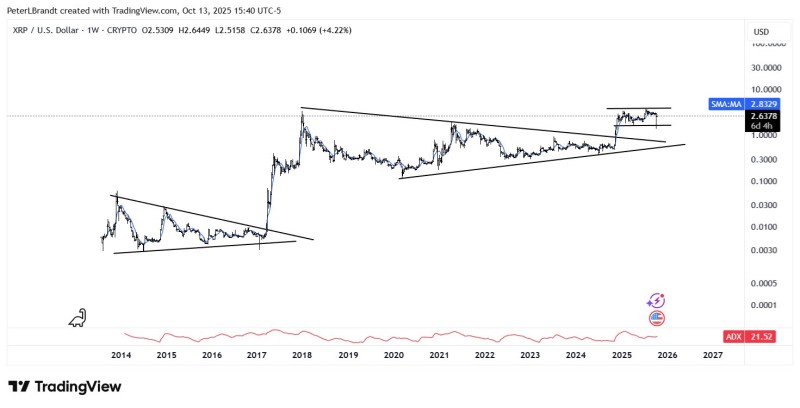
XRP has caught the eye of seasoned trader Peter Brandt, who recently called its price chart "a purer long-term chart" due to its textbook adherence to classical technical patterns. XRP's weekly chart shows several notable long-term formations. The asset has repeatedly formed symmetrical triangles during consolidation phases, with similar setups appearing between 2014-2017 and 2020-2024, both of which preceded significant upward breakouts. Current resistance sits near $2.83 around the simple moving average, while support holds around $2.00 at the lower boundary of the consolidation range. The ADX momentum indicator reads 21.52, suggesting weak trend strength for now but potential volatility expansion ahead. This structural clarity is exactly what drew Brandt's attention as a prime example of charting discipline.
Beyond the Charts
While technicals drive much of the conversation, fundamentals matter too. Ripple's partial legal victory over the SEC in 2023 clarified XRP's status in certain contexts, bringing institutional players back to the table. Ripple keeps pushing real-world adoption through cross-border payment solutions where XRP plays a key role. Historically, XRP tends to mirror Bitcoin's bull cycles, often with magnified moves once momentum kicks in.
Breaking above $3.00 decisively is crucial for triggering another sustained rally. New legal challenges or unfavorable policy shifts could dampen sentiment and slow adoption momentum. With ADX showing limited trend strength, a retest of support near $2.00 remains possible before any meaningful breakout occurs.
 Peter Smith