 Alex Dudov

⬤ XRP's price action is catching attention as its current structure replicates the pattern from 2016–2017. A comparison chart reveals four distinct phases unfolding almost identically across both periods. The left panel shows XRP's 2017 setup, while the right displays 2025's structure, with both sequences labeled 1 through 4 following similar rounded paths.
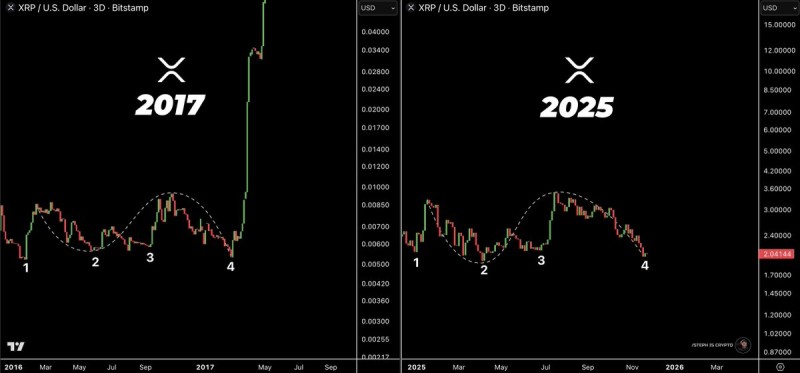
⬤ Back in 2017, XRP moved through rounded corrective waves before exploding upward. The asset traded sideways through mid-2016, formed a multi-step base across phases 1, 2, and 3, then dropped to point 4. From there, XRP launched into a steep rally from under $0.01. The 2025 chart mirrors this exactly: XRP climbed from early-year lows around 2.00 to roughly 3.60 at point 3, then pulled back to about 2.04 at point 4, matching both the shape and timing of the earlier cycle.
⬤ The visual similarity between these periods is striking. The 2025 rounded swings echo the spacing, curvature, and progression of 2017. The right-side chart shows XRP following the same oscillation: an initial drop at point 1, a rounded climb into point 3, and a decline toward point 4 — exactly matching the structure before XRP's major 2017 breakout.
⬤ Recurring structural patterns like this often shape sentiment around assets with strong historical cycles. The alignment doesn't guarantee past outcomes will repeat, but it shows why traders are watching closely. As XRP continues forming these multi-step structures, the comparison highlights how historical behavior influences expectations around future volatility and market positioning.
 Alex Dudov


