 Victoria Bazir
⬤ XRP traders are noticing something familiar on the long-term charts—the token's price structure looks nearly identical to what happened back in 2017. The three-day chart shows XRP forming the same liquidity wick and consolidation setup within a rising Gaussian Channel, which traders use to track broader market momentum.
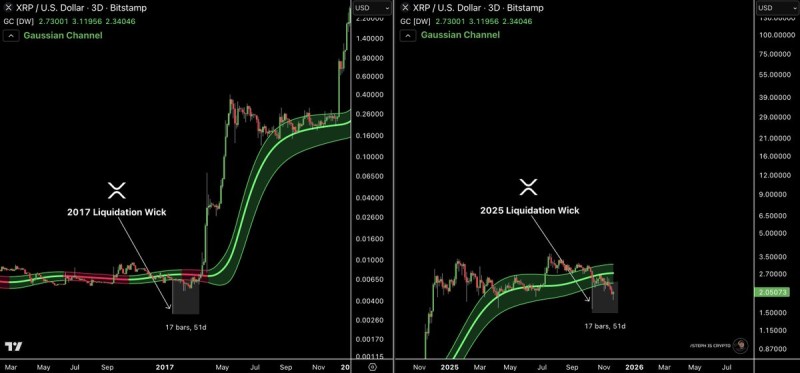
⬤ Side-by-side comparisons of 2017 and 2025 reveal striking similarities in both timing and structure. In each case, XRP shot up sharply before pulling back in a liquidity sweep that lasted about 17 bars—roughly 50 days. This time around, XRP dropped toward the Gaussian Channel's lower edge near $2.05 before bouncing back toward the middle of the channel.
⬤ The technical setup is holding firm. XRP is still trading above long-term support and maintaining its upward-sloping channel. The Gaussian Channel bands continue pointing upward, signaling the broader trend hasn't broken despite recent price swings. Volume patterns during the pullback mirror 2017 as well—selling pressure appears concentrated and short-lived rather than continuous.
⬤ This repeating pattern matters because XRP has historically been a high-volatility player when market sentiment shifts. Similar structures in past cycles led to extended consolidation periods before the next major move. While history doesn't guarantee the same outcome, seeing this familiar long-term structure again shows how past market behavior continues shaping current trader positioning and expectations.
 Victoria Bazir


