 Marina Lyubimova

⬤ XRP displays a bullish divergence on the daily chart - the price records fresh lows while the momentum gauges post rising troughs. The token sits beneath its 20-day exponential moving average - each effort to climb past that line ends in rejection. The price looks feeble - yet the hidden momentum tells another tale.
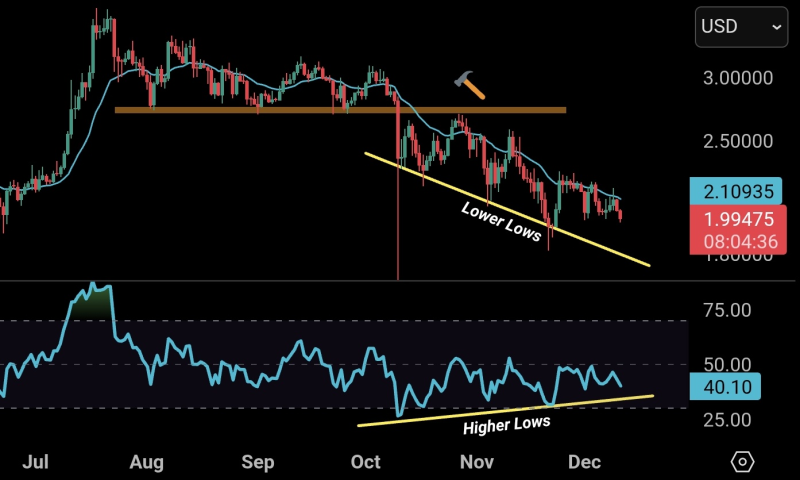
⬤ The chart shows XRP following a downward sloping trendline that marks a string of lower lows, but the RSI travels in the opposite direction and prints higher lows across the same span. One analyst remarked that XRP will probably retest both the lower low line plus the higher low line as the pattern develops. Such divergence usually signals that selling pressure is fading even while the quote keeps falling.
⬤ Trading near the 20-day EMA has proved hard for XRP bulls. Sellers appear at that average and turn it into firm resistance. A shaded band on the chart shows an old support zone that later became resistance - this band adds a second hurdle but also keeps the price locked inside the descending channel. Despite that momentum has stayed fairly intact during recent weeks.
⬤ Bullish divergences often serve as early hints that a trend reversal is near. If XRP retests the key trendlines and the divergence keeps building, momentum could swing back toward buyers. Until the price climbs as well as holds above the 20-day EMA, overhead pressure stays active and will cap rallies.
 Marina Lyubimova


