 Usman Salis

⬤ XRP is trading below a bearish EMA ribbon on the 3-day chart, and history shows this isn't a signal to ignore. Looking back over more than ten years of price action, every time this setup appeared, XRP entered a prolonged downtrend. There are no exceptions in the historical record so far.
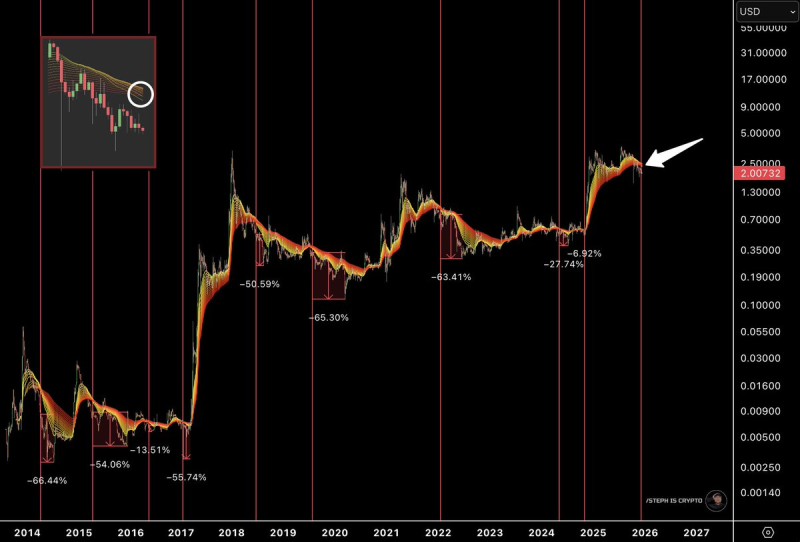
⬤ These weren't quick dips or temporary shakeouts. Each time the EMA ribbon turned bearish and price stayed below it, XRP experienced sustained selloffs lasting several months. The losses ranged from around 27% on the lighter side to as steep as 66% during more severe corrections. The longer the ribbon stayed bearish, the deeper the drawdown tended to go.
⬤ Right now, XRP is hovering near $2.00 and sitting below that same EMA ribbon. The chart shows how similar positioning in earlier cycles evolved into extended downtrends, with the ribbon acting as a ceiling that prevented any real recovery until a major reset happened. This pattern has played out consistently across multiple market cycles, making it a meaningful technical reference on higher timeframes.
⬤ Higher-timeframe signals like this tend to carry more weight than short-term noise. When a setup has repeated the same way for over a decade, it shapes how traders think about risk and direction. XRP is once again in familiar territory—below a bearish ribbon that has historically meant months of correction, not just a quick bounce back.
 Usman Salis


