 Saad Ullah
⬤ XRP fell to the blue target zone early today, hitting the $1.98 mark that represents the 100 percent Fibonacci extension of the current correction. This level has been highlighted as a critical support region where the market could finally find some footing. The key question now is whether buyers will step in at this zone and try to push price back up after the recent slide.
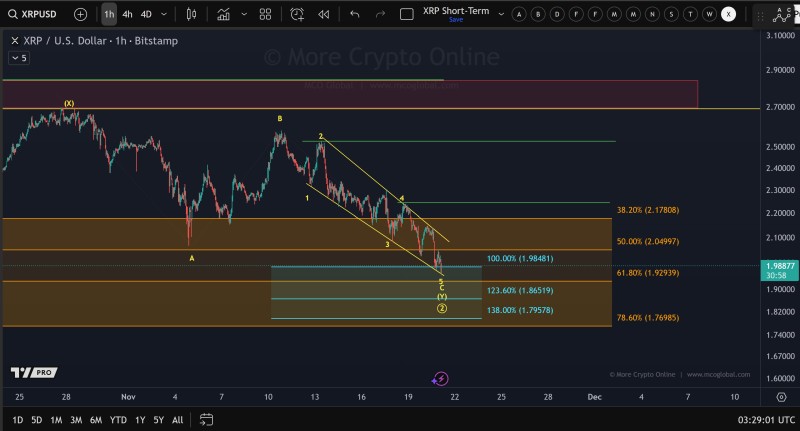
⬤ The chart shows a completed five-wave drop into support, matching expectations for a possible wave 2 low. XRP briefly dipped toward deeper targets between $1.86 and $1.79 before settling near the main support cluster. For any real recovery to take hold, price needs to break back above $2.24 first. That level acts as a major resistance point, and clearing it would suggest the market might have put in a local bottom. Until that happens, XRP could still see more downside pressure if the bounce from this support zone doesn't gain strength.
⬤ Momentum has been weak throughout this decline, with price stuck in a descending channel that's been respected at every turn. The support area around the blue box combines Fibonacci levels with previous liquidity zones, making it particularly important. Traders are watching to see if this zone can produce the expected reaction. A solid bounce could shift sentiment and potentially push price toward mid-range levels like $2.05 and $2.18, which line up with key Fibonacci retracements on the chart.
⬤ This setup matters because XRP is at a point where the trend could either continue down or reverse. A strong reaction from support might stabilize things short-term and help clarify what comes next. But if price can't reclaim $2.24, the correction stays in play and volatility could continue across the broader market.
 Saad Ullah


