 Peter Smith

⬤ XRP has been under pressure for weeks, but its daily chart now shows an interesting bullish divergence that might indicate a shift in momentum. The asset keeps hitting lower lows on price, but the RSI indicator is actually forming higher lows. This mismatch suggests the selling pressure is fading even though prices are still trending down.
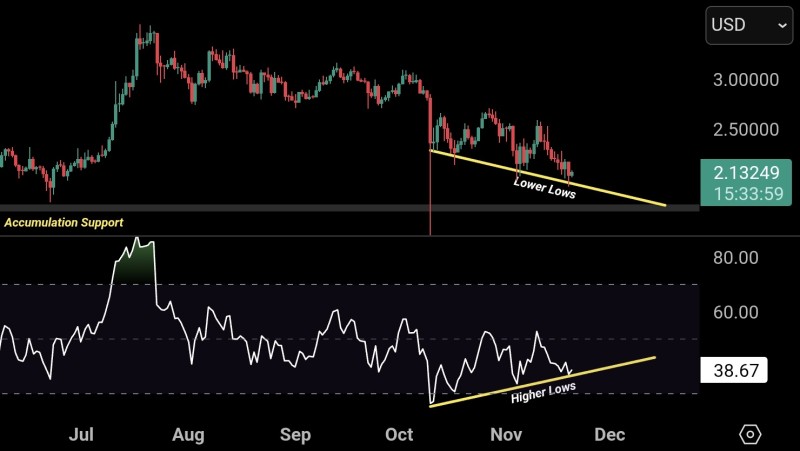
⬤ Right now XRP is trading around $2.13, sitting just above an accumulation zone that's held up as support several times since summer. The price has been testing lower levels through October and November, but the RSI trendline is pointing upward with higher lows and improving momentum. This gap between falling prices and rising RSI is a classic bullish divergence—often seen before reversals start forming. Things can stay choppy during these setups, but the longer this pattern builds, the more significant it usually becomes.
⬤ The momentum signals suggest the current decline might be running out of steam. RSI is hovering around 38, which typically marks a zone where upward moves can begin after extended selling. Price action remains squeezed along a downward support line, showing sellers may be losing grip. If XRP holds above this accumulation area, the divergence could eventually trigger a stronger bounce when market sentiment improves.
⬤ This pattern matters because bullish divergences on daily charts often come before momentum shifts or relief rallies. The mix of solid support and strengthening relative strength indicates XRP might be nearing a volatility breakout. While we still need confirmation, the chart setup shows a structure that could shape near-term sentiment across the crypto market.
 Peter Smith


