Peter Smith
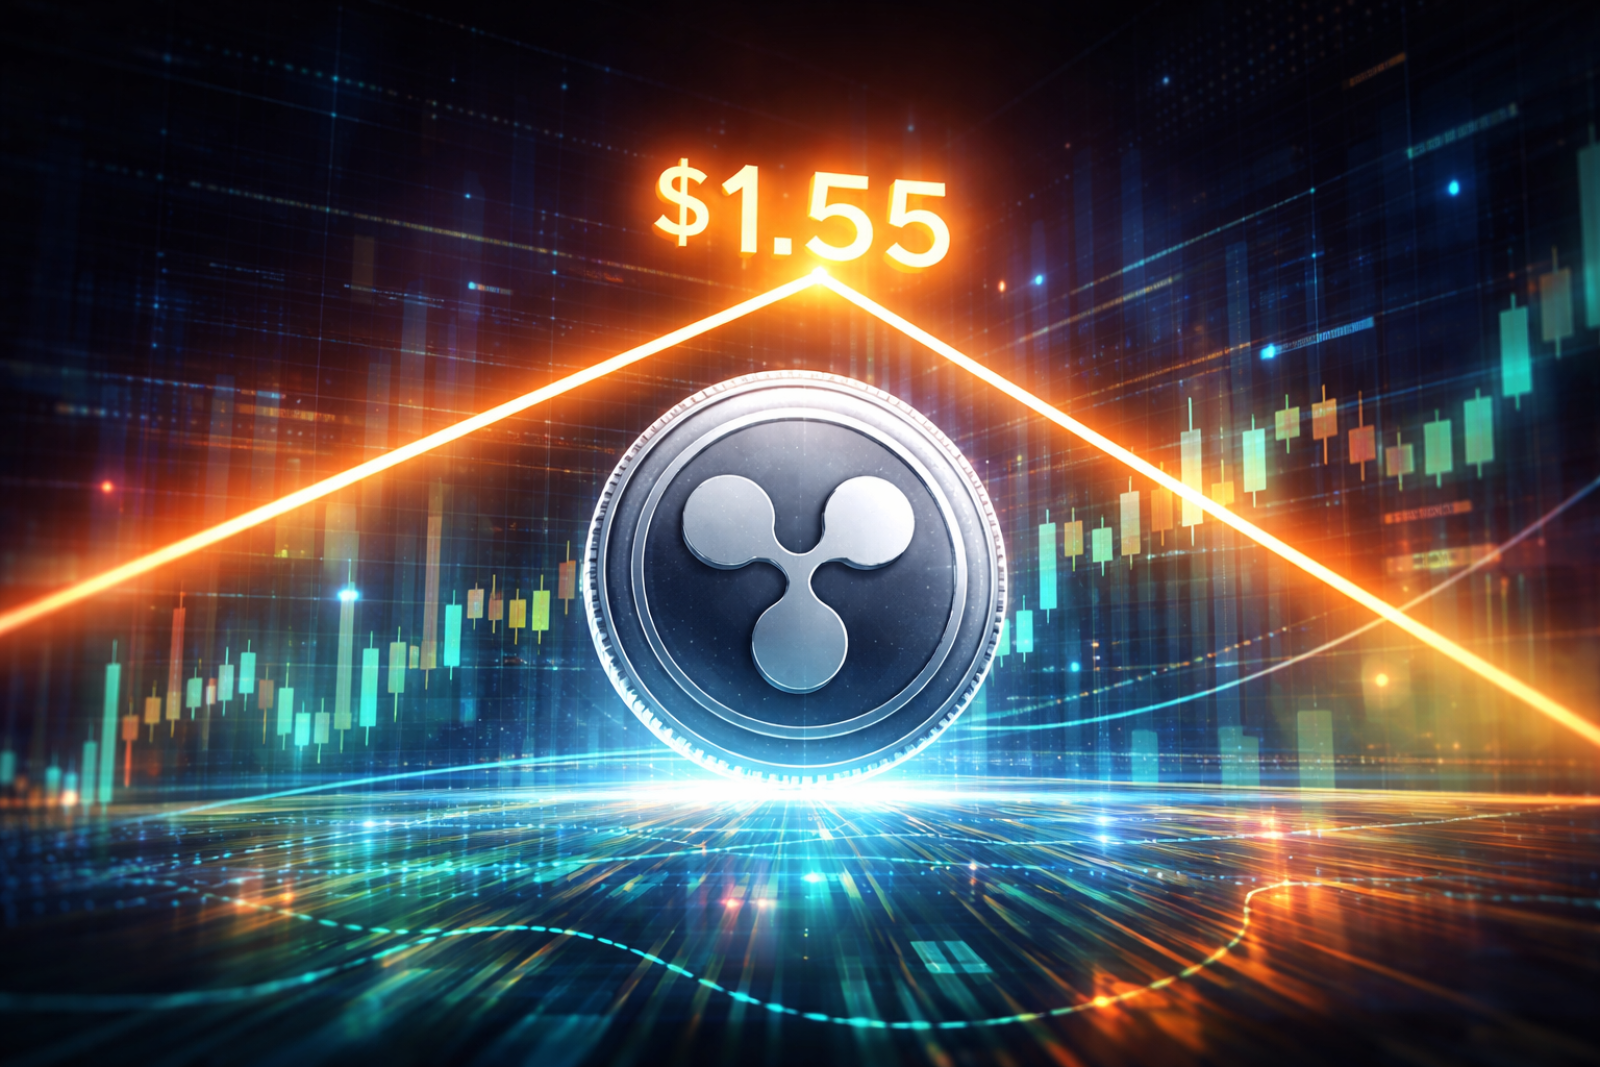
XRP is approaching a decisive technical level as price pushes toward the upper boundary of a symmetrical triangle. Analyst ChartNerd flagged the move, pointing to the $1.50-$1.55 zone as the first imminent barrier within the current structure - one that has already capped multiple previous attempts. What matters right now is that the level remains unbroken, and the pattern is still fully intact.
For traders watching XRP Price Analysis: $1.50 Resistance Could Open Path to $1.80-$2, this setup checks out. The current move aligns with earlier projections that flagged this exact zone as the trigger area between extended consolidation and a broader directional push.
Price is pushing into resistance - not breaking it. That distinction defines everything about the current setup.
XRP Triangle Pattern Compresses Toward a Decision
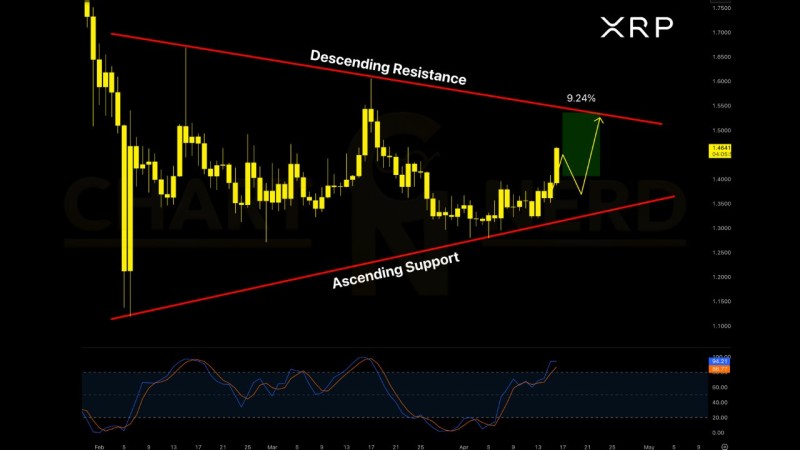
The chart shows XRP trading between descending resistance and ascending support, forming a classic symmetrical triangle. Lower highs and higher lows are converging, and volatility has contracted noticeably as the pattern tightens toward its apex.
Compression phases like this typically precede expansion. The triangle acts as a buildup structure - price action coiling before a larger move resolves the tension. XRP has gone through similar setups before, and historically they've led to meaningful volatility once the pattern breaks one way or another.
At this stage, though, price is still contained. Nothing has resolved yet.
The triangle is compressing toward its apex. Repeated tests of resistance tend to weaken the level over time - that's the key dynamic to watch right now.
Why the $1.50–$1.55 XRP Level Is the Key Trigger
The $1.50-$1.55 region sits directly on the descending resistance line that has defined the triangle's upper boundary. It's not just a round number - it's a structural level, and that's what gives it weight.
A clean break above this zone would mark the first real structural shift, potentially opening the path toward higher targets. A rejection, on the other hand, keeps XRP locked inside the triangle and extends the consolidation phase. Across broader XRP technical analysis, this same zone keeps coming up as the dividing line between those two outcomes.
The XRP Price Analysis: Symmetrical Triangle Breakout Approaching piece covered exactly this structure - the current test is a continuation of that setup, not a new development.
XRP Chart Structure Traders Are Watching
The sequence playing out on the chart is straightforward:
- Price is forming higher lows into resistance
- The triangle is compressing toward its apex
- XRP is now testing the upper boundary at $1.50-$1.55
Each of these elements reinforces the others. The pattern is clean, the structure is defined, and the move into resistance raises the stakes of the next reaction. Repeated tests don't strengthen a level - they erode it. But erosion isn't a breakout confirmation. That only comes with a close above resistance.
Until price closes above the $1.50-$1.55 zone, the symmetrical triangle stays intact and the pattern remains unresolved.
XRP Awaits Confirmation - Rejection or Breakout?
XRP is testing, not breaking out. The symmetrical triangle continues to define the structure, and the $1.50-$1.55 zone remains the line in the sand. A confirmed move above it marks the first structural shift. A rejection sends price back into consolidation.
Nothing is confirmed until it is. That's the entire premise of this setup - and it's why the next reaction at this level carries more weight than the approach itself. Traders following the XRP Price Analysis: Falling Wedge Setup Signals Breakout Potential Above $2 will want to watch how price handles this resistance before drawing conclusions about the broader move.
 Peter Smith