 Usman Salis

⬤ XRP appears to be forming a base after several months of downward movement. The asset went through sustained selling pressure before experiencing a liquidity sweep that seems to have changed market dynamics. The daily chart reveals XRP transitioning from a strong rally into extended sideways trading, then breaking down before finally finding stability near key demand levels.
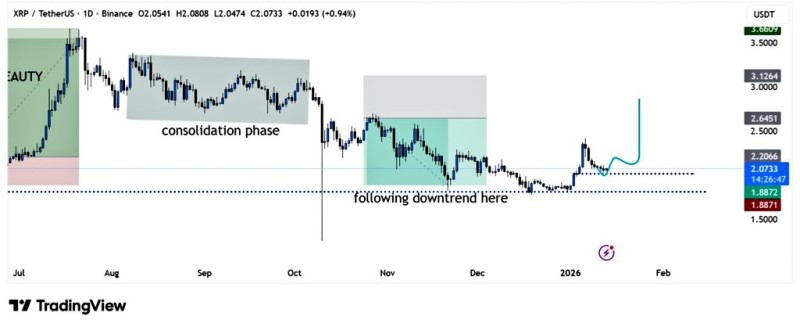
⬤ Looking at the chart structure, you can see distinct phases. After hitting its peak in mid-2025, XRP spent time moving sideways in a wide range before dropping lower through October and November. During that decline, price followed a bearish pattern and eventually swept below previous support levels. This triggered a bounce from the $1.85–$1.90 demand zone, where the downward momentum started to slow and sellers backed off.
⬤ Since bouncing from that demand area, XRP has traded in a tight range with decreasing volatility. Attempts to push lower are getting absorbed, while rallies remain shallow and controlled. This is different from the earlier downtrend when every bounce got sold aggressively. The compressed range indicates sellers aren't in control anymore and buying interest is picking up at these levels.
⬤ This shift is meaningful because base formation often marks a change from trending to balanced price action. While consolidation doesn't guarantee an immediate rally, it shows selling pressure is drying up. For XRP, staying above the recent demand zone and maintaining this tight range keeps the base structure intact. How price moves from here will show whether the market stays in accumulation mode or starts trending again.
 Usman Salis


