 Alex Dudov

⬤ XRP just shifted into what traders are calling Phase 4 on the long-term chart—basically the next leg of its bigger market cycle. Looking at the multi-year price action, you can see it's broken out of a long consolidation period and is now following a pattern that's played out before. The current chart setup puts XRP squarely in Phase 4 territory as it rides the trend higher.
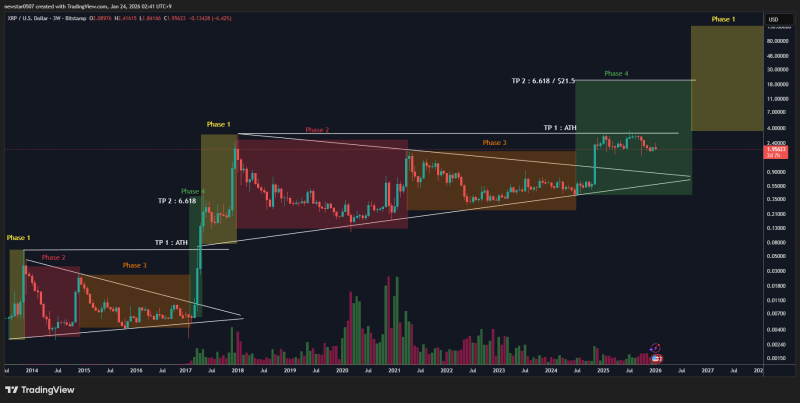
⬤ Here's how the cycle works. Phase 1 is when price surges hard. Phase 2 is the pullback and correction. Phase 3 is where things get tight—price compresses into a narrowing range. XRP recently broke out of that Phase 3 squeeze and pushed into Phase 4. Right now it's holding around the $2.00 level, staying inside the Phase 4 zone instead of falling back into earlier phases. That's the key—staying above prior resistance levels shows the structure is still intact.
⬤ The chart shows some big reference points ahead, including Fibonacci extension levels that line up with past cycle tops. The most notable target sits at a 6.618 Fibonacci extension near $21.5—that's the long-term goal, not something expected next week. These levels come from analyzing how XRP moved through previous cycles on the same timeframe. Volume tells the story too: it spikes during breakouts and dries up during corrections and consolidation, which fits the phase pattern perfectly.
⬤ Why this matters: Phase 4 isn't just a random label—it shows XRP is following its historical cycle playbook. These phase frameworks help make sense of where an asset is in its bigger journey and explain why volatility and momentum shift the way they do. As long as XRP stays above its Phase 4 breakout levels and doesn't slip back into Phase 3 territory, the long-term bullish structure stays in play. That's what the market will be watching to gauge whether XRP can eventually reach those higher targets in the months and years ahead.
 Alex Dudov


