 Saad Ullah
XRP's current price action is giving traders serious flashbacks. We're not talking about vague similarities here. The patterns, the consolidation, the positioning around $2.85 - it's all eerily familiar. And if history has anything to say about it, what comes next could be explosive.
What the Chart Is Screaming
Crypto analyst CRYPTOWZRD recently pointed out something that's got the community buzzing - the chart looks almost identical to 2017's setup before the legendary parabolic run.
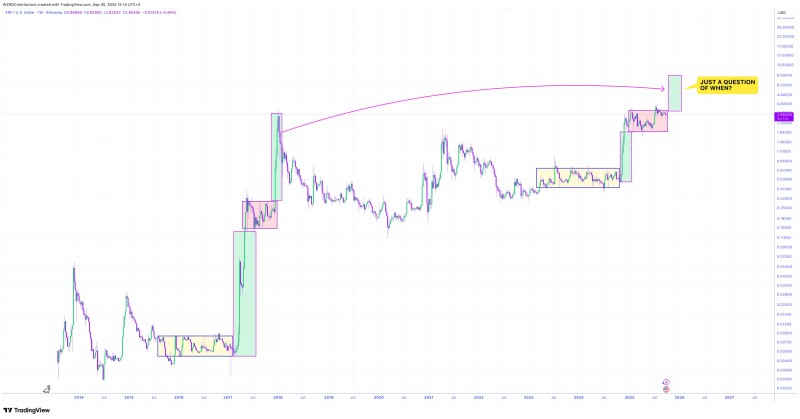
The weekly timeframe tells the whole story. XRP's been grinding sideways in consolidation zones, just like it did before breaking out in 2017. Right now it's hovering around $2.85, sitting in what looks like an accumulation phase. There are two levels that matter most:
- $3.65 resistance - This is the line in the sand. Push through here and the floodgates open for the next bullish wave.
- $4.50+ territory - Break this and XRP enters price discovery mode, meaning we're in uncharted waters with no ceiling in sight.
The chart's got these consolidation boxes marked out with breakout arrows showing the path forward. Someone even scribbled "Just a question of when?" on there, which pretty much sums up where traders' heads are at. It's not about whether this happens anymore.
Why Bulls Are Loading Up
The stars are aligning for XRP in ways they haven't in years. Ripple's legal battle with the SEC ended with a partial win that changed everything - confidence is back. The company's still pushing hard on cross-border payments, which keeps real demand flowing for XRP. And let's not forget where we are in the crypto cycle. When Bitcoin stabilizes and shows strength, altcoins historically go wild. XRP's been waiting its turn.
 Saad Ullah


