Usman Salis
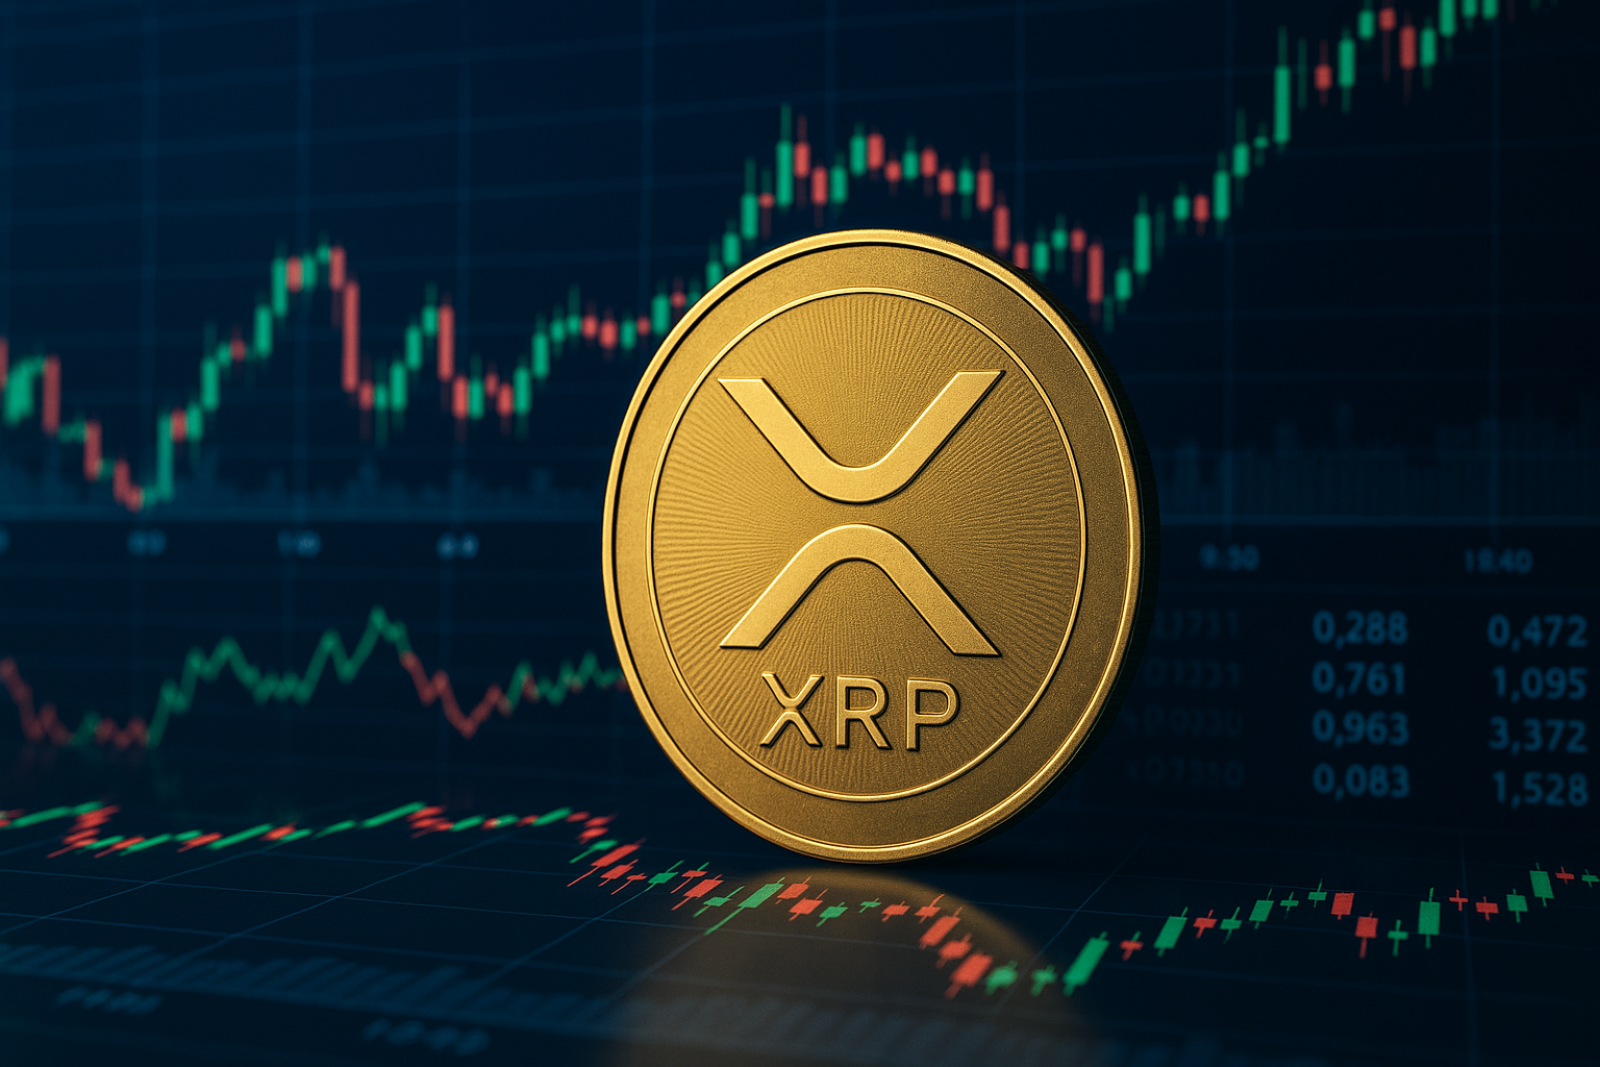
Crypto markets have a funny way of rhyming with the past. Right now, XRP is showing the exact same technical pattern that preceded its legendary 2017 moonshot.
The 2017 Playbook Is Back
Trader Sjuul | AltCryptoGems points out what everyone's thinking: the token is holding firm above its moving average with zero signs of breaking down. The question isn't if a breakout happens - it's when.
The parallels are impossible to ignore. Back in December 2017, XRP exploded from under $0.30 straight past $3.30 in a matter of weeks. Fast forward to September 2025, and we're looking at an almost identical consolidation pattern. The green moving average band that launched the last rally? It's doing the exact same thing right now, acting as a springboard for what could come next.
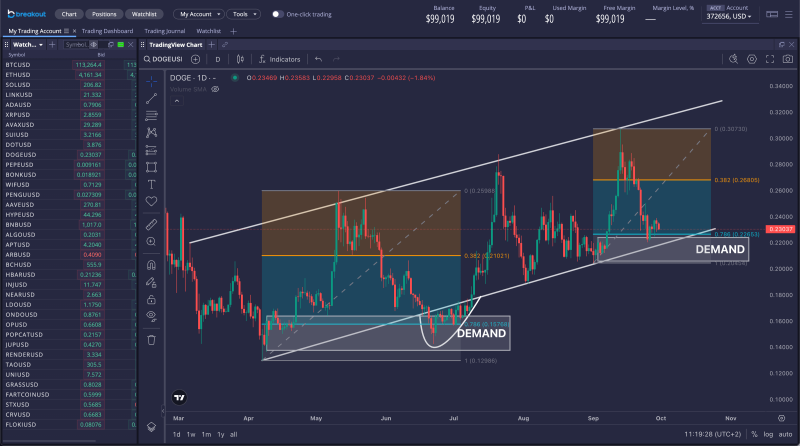
The price action tells a clear story. XRP is holding the $2.10-$2.40 support zone like it's glued there, and as long as that holds, bulls are still running the show. Above, there's a roadmap of resistance levels: $7.95, $11.31, then the $15.50-$20.00 range. If momentum catches fire like 2017, we could see extension targets pushing past $33.
Why This Time Could Be Different (But Also the Same)
The backdrop is shifting in XRP's favor. The dollar's weakening, bond yields are dropping, and suddenly alternative assets look a lot more attractive. Ripple's ecosystem isn't sitting still either - tokenization and cross-border payment tech keep adding fuel to the fundamental story. Even the RSI at the bottom of the chart is bouncing back from oversold territory, signaling fresh buying pressure coming in.
 Usman Salis