 Peter Smith

XRP just delivered exactly what the charts predicted. After weeks of technical analysis pointing to a five-wave bullish structure, the token hit $2.95 and is now inches away from cracking the $3 barrier.
What the Technicals Show
Trader Dark Defender posted side-by-side charts from September 28 and October 1, showing how XRP followed the projection almost perfectly. The token nailed the 161.8% Fibonacci extension at $2.88 and is now pushing toward the 261.8% level at $2.99. For anyone watching Elliott Wave patterns, this is playing out like a textbook case.
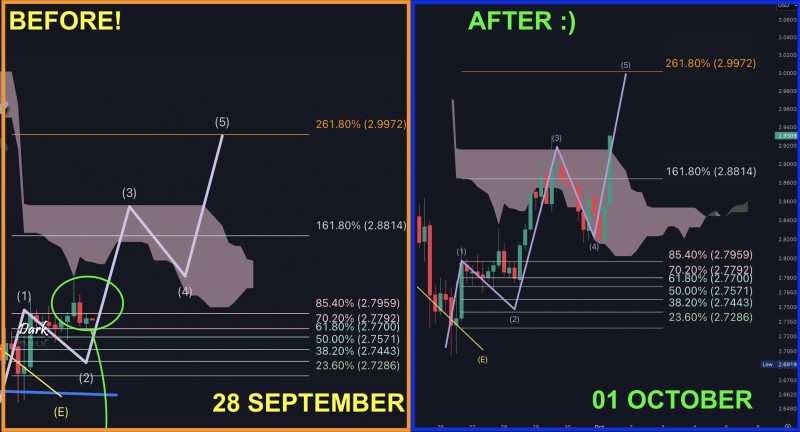
The chart tells a clean story:
- Current Price: $2.95 with strong bullish momentum intact
- Wave Structure: Five-wave formation still holding, suggesting more room to run
- Support Zone: $2.75–$2.80 providing a solid floor
- Resistance: $3.00 is the immediate hurdle everyone's watching
- Volume: Buy-side activity is spiking, confirming this isn't a fake-out
That $3 level isn't just a round number - it's a psychological ceiling that could open the floodgates if broken.
Why This Rally Has Legs
Market confidence is back across altcoins, and XRP is riding that wave hard. The technical setup is what's really catching eyes though. When a token moves along Fibonacci extensions this cleanly, it tends to attract more buyers who see the pattern working. There's also a speculative element here - traders remember what happened during XRP's previous parabolic runs, and this chart structure looks eerily similar.
If XRP punches through $3 with volume behind it, the next Fibonacci targets come into play fast. A pullback to $2.75 wouldn't kill the bullish case - it would actually set up a healthier base for the next move higher. Right now, momentum is accelerating, and the next few trading sessions will show whether XRP can sustain this breakout or needs to consolidate first. The Elliott Wave projection has been spot-on so far, and that's got bulls betting on higher prices ahead.
 Peter Smith


