 Marina Lyubimova
XRP's monthly chart analysis suggests massive upside potential, with technical patterns pointing toward unprecedented price levels that could transform long-term holders into millionaires.
The Big Picture Setup
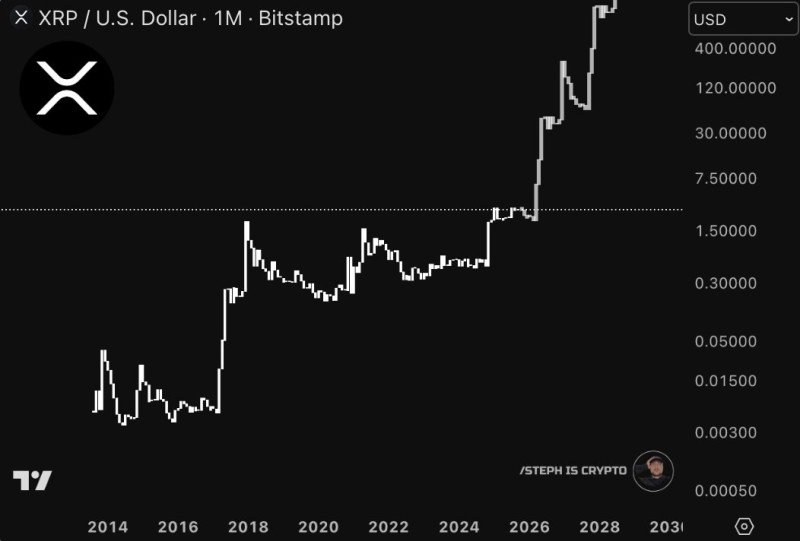
Could we be looking at XRP's most explosive run ever? A compelling long-term chart from @Steph_iscrypto is making waves in the crypto community, showing projections that push XRP into triple-digit territory. The analysis has XRP believers more bullish than ever, with many already calling themselves "future millionaires" based on these technical patterns.
Key Technical Levels to Watch
The monthly XRP/USD chart reveals several critical elements: years of consolidation between 2018 and 2024 with resistance consistently hitting around $1.50, a clear breakout structure finally emerging after this extended sideways movement, aggressive upside targets mapped at $7.5, $30, $120, and potentially above $400, and a parabolic pattern that mirrors XRP's explosive cycles from 2017 and 2021. This technical setup suggests XRP might be entering what analysts call a "super-cycle" phase, where patient holders could see life-changing returns.
The fundamentals are lining up too. Ripple's partnerships with major banks keep expanding, there's growing institutional interest in crypto assets with real-world utility, and we're seeing classic altcoin season patterns where projects like XRP typically outperform once Bitcoin finds its footing. When you combine these fundamentals with the technical projection, the case for a major XRP surge becomes increasingly compelling for long-term investors willing to ride out the volatility.
 Marina Lyubimova


