 Sergey Diakov
⬤ XRP has hit a critical technical turning point as its monthly Relative Strength Index reveals a clear momentum shift. Unlike the last two cycles where the RSI bounced straight off its moving average and kept climbing, this time it's dropped below without any bounce—signaling something's fundamentally different about how the market's behaving right now. The chart makes this divergence impossible to ignore, putting all eyes on what happens next with momentum confirmation.
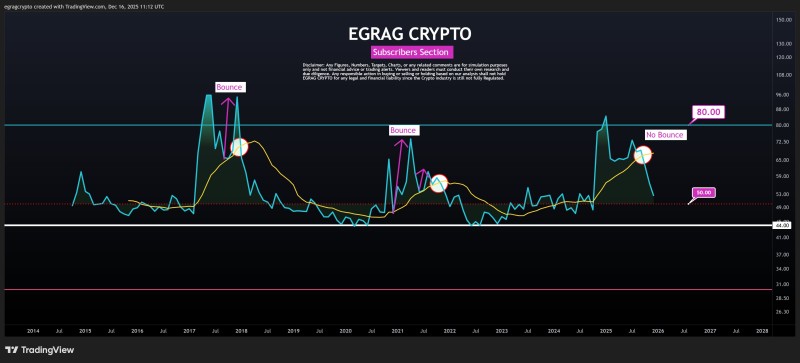
⬤ That said, bulls aren't out of the game yet. There's roughly a 55 to 60 percent chance this is just a deeper mid-cycle correction rather than the beginning of something worse. The RSI is still hanging on in the 44 to 50 support zone—an area that's historically caught price during pullbacks. For the bullish case to play out, the RSI needs to hold above this zone, push back above its moving average, put in a higher low, and start heading up without printing fresh lows. If all that lines up, we're looking at a delayed continuation, not a cycle top.
⬤ The bearish alternative carries about 40 to 45 percent odds and hinges on the RSI failing to reclaim its moving average. If it keeps getting rejected around 50 while making lower highs, that's classic distribution behavior. In that scenario, XRP would likely grind sideways or drift lower for an extended stretch, with any rallies just temporary relief moves. The chart shows how previous momentum supports have weakened, making the next confirmation signal that much more important.
⬤ This matters beyond just XRP because monthly RSI trends reflect long-term market sentiment, not just short-term noise. While the current setup doesn't confirm a market top, it absolutely demands confirmation before the next major move. Whether XRP reclaims momentum or extends consolidation will shape broader expectations around cycle strength, risk appetite, and trend sustainability across the entire digital asset space.
 Sergey Diakov


