 Peter Smith

⬤ XRP's monthly Relative Strength Index is sitting at 48 right now, and that's got chart watchers paying attention. This level keeps showing up at cycle bottoms throughout XRP's history. The monthly RSI has dipped below 50 multiple times since 2014, and each time it's marked a momentum slowdown that eventually reversed. The pattern's highlighted clearly on long-term charts—those 40-50 RSI zones line up with previous turning points across different market cycles.
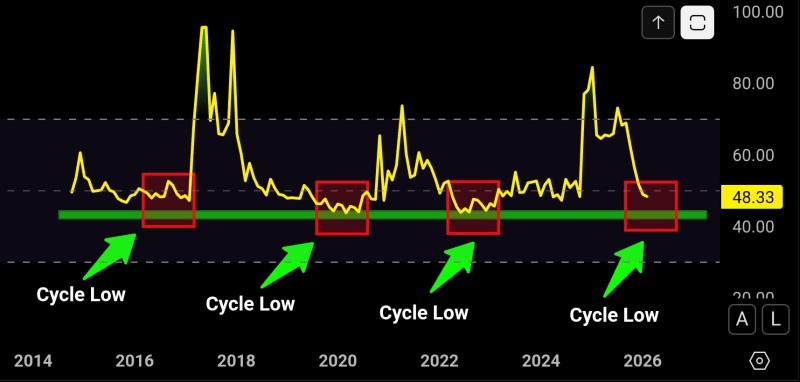
⬤ What makes this interesting is how rarely XRP's monthly RSI actually drops this low. Monthly momentum indicators move slowly, so when they hit these levels, they're capturing extended consolidation periods rather than quick dips. The chart evidence goes back a decade, showing the RSI spending time in this same zone before momentum eventually shifted higher. Past instances are marked with boxes and arrows on the historical chart, showing the pattern repeating at similar RSI readings.
⬤ Here's why traders care: monthly RSI below 50 signals that long-term downside momentum is losing steam. It doesn't predict when or how high XRP moves next, but it identifies a structural condition that's appeared at previous cycle lows. Smart money watches these long-term momentum zones because they shape market sentiment and often coincide with phases where selling pressure moderates. XRP hitting 48 on the monthly RSI puts it right back in that historically significant range where momentum has bottomed out before.
 Peter Smith


