 Marina Lyubimova

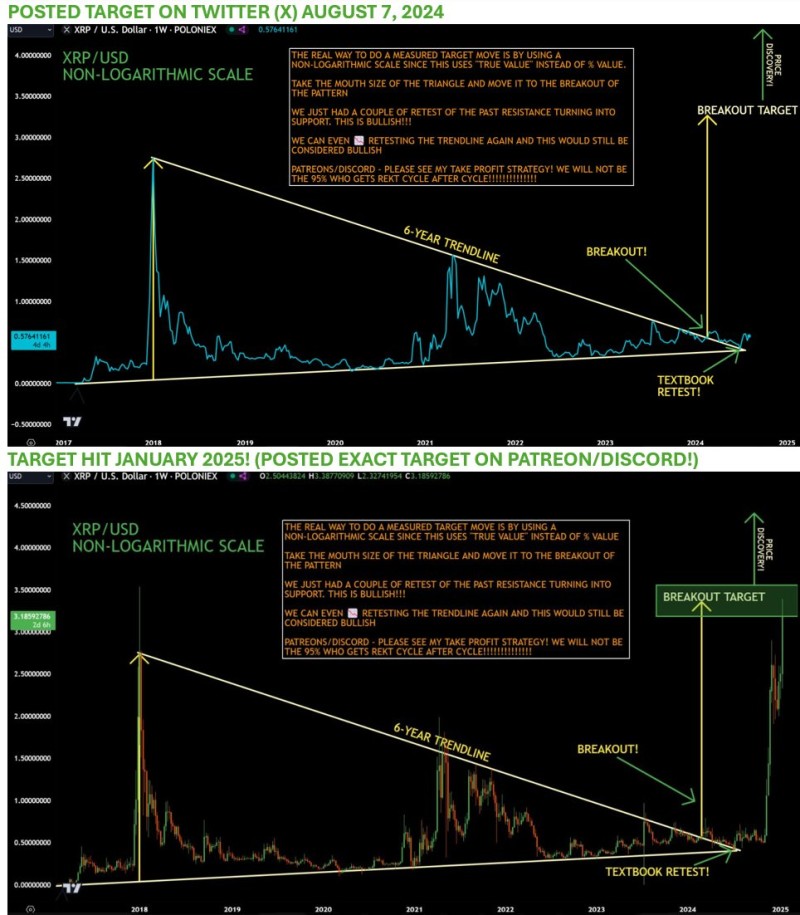
XRP just delivered one of the most satisfying technical setups crypto traders have seen in years. After breaking out of a massive 6-year triangle pattern, the digital asset hit its projected target with surgical precision.
XRP Price Breakout Unfolds Like a Textbook Example
A crypto analyst recently shared on X how XRP's price action played out exactly as expected. The setup was built on a 6-year triangle pattern that had been forming since the previous bull market.
During the bear market, XRP traded in a crucial accumulation zone between $0.28 and $0.43. This range represented where long-term holders accumulated while weak hands got shaken out.
The magic happened when XRP broke through the upper trendline, then came back to successfully retest the breakout level as new support. From there, XRP surged into its current trading range of $0.57 to $1.18.
Technical Analysis Points to Measured Move Success
The trader used a non-logarithmic scale for accurate measurement, taking the "mouth size" of the triangle pattern and projecting it from the breakout point. This measured move approach predicted XRP would reach specific levels, which January 2025 proved correct.
Key levels include the original accumulation zone of $0.28 to $0.43, followed by current price action at $0.5741 and $1.1897.
What's Next for XRP Price After Target Achievement?
Now that the breakout target has been reached, traders are asking where XRP goes next. The same technical principles that identified this successful move might reveal the next major price objective.
The clean nature of the breakout and retest indicates strong underlying conviction from participants. When technical patterns play out this precisely, it often leads to extended moves beyond initial targets.
For now, XRP holders can celebrate watching a textbook pattern unfold exactly as predicted. Whether this leads to even higher targets remains to be seen, but the precision has caught the crypto community's attention.
 Marina Lyubimova


