Saad Ullah
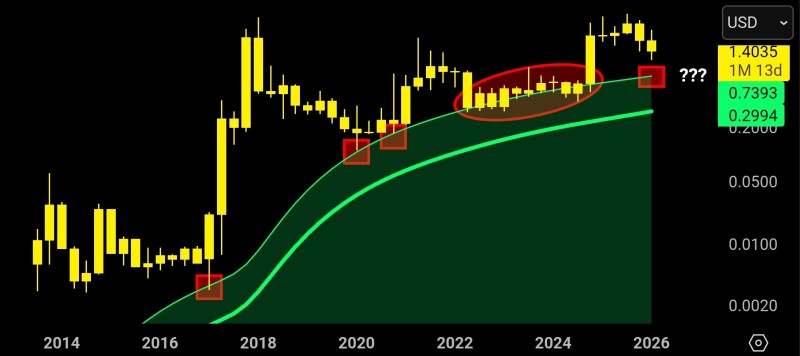
XRP is sitting at one of the most watched technical levels on its long-term chart. The token is pressing against an ascending trend support that has acted as a floor at every major cycle low since 2017, and traders are paying close attention to what happens next.
A Trend Line That Has Survived Three Market Cycles
The monthly chart shows a rising support curve that dates back nearly a decade. Price touched and bounced from this band in 2017, 2020, and again in 2022 before each successive recovery phase. Right now, XRP is sitting just above that same band.
If it holds, the long-term uptrend structure stays intact. More context on where XRP stands technically is available in recent XRP price analysis and XRP technical setup coverage.
What a Breakdown Could Trigger
Monthly candle data shows XRP hovering right above the trend band with little buffer to spare. Historically, when this kind of ascending support breaks on high timeframes, it tends to shift the broader narrative quickly. A decisive close below the trend line would remove the structural floor that has guided the asset through every major bear phase, potentially opening the door to correction levels not seen since earlier cycle lows. Broader forecasts touching on this scenario are covered in recent XRP price prediction reports.
On the flip side, a successful defense of this zone has historically preceded meaningful upside moves. If buyers step in here and XRP manages to stabilize, the same pattern that played out in 2020 and 2022 could set the stage for a renewed push higher once momentum returns. The level is simple: hold it and the long-term bull structure survives; lose it and sentiment shifts fast.
 Saad Ullah