 Peter Smith

Something interesting is happening in XRP's futures markets. With the indicator flipping positive again around the $2.4 mark, market watchers are asking whether we're seeing the early stages of another accumulation phase by larger players.
Buyers Take Control Again
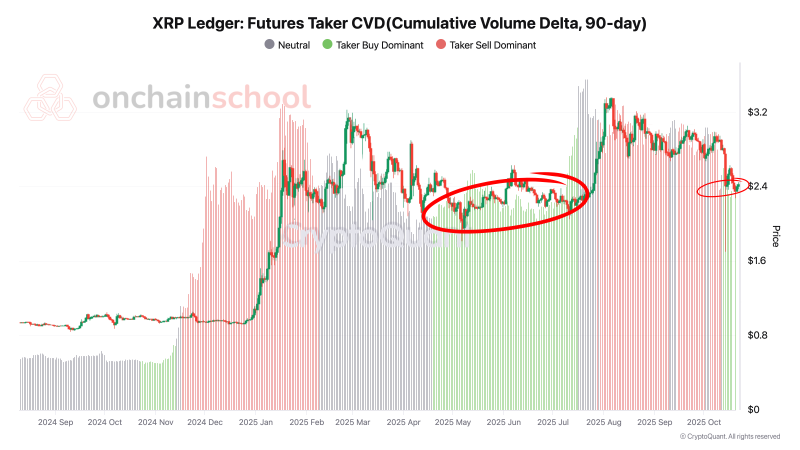
According to data from Onchain School, the 90-day Cumulative Volume Delta (CVD) just turned green for the first time in six months. The last time this happened was in April 2025, right before XRP doubled in price over the following weeks. The CryptoQuant chart reveals a notable change in trader behavior. After months of seller dominance shown in red, the CVD has shifted back to green, meaning buy orders now outnumber sell orders in the futures market.
Here's what stands out:
- The 90-day CVD turned green in October 2025 for the first time since April
- XRP is trading near $2.4, the same level where accumulation began earlier this year
- Both circled zones on the chart (April and October) mark transitions to buyer-dominated conditions
- When this happened in April, XRP rallied from roughly $1.6 to $3.2
The visual similarity between these two periods suggests XRP might be following a familiar playbook, with the green CVD hinting that professional traders are positioning for what comes next.
What CVD Actually Tells Us
The Cumulative Volume Delta tracks the difference between buy and sell orders in futures markets. When it rises and turns green, buyers are actively pushing prices higher through market orders. When it drops into red territory, sellers are in control, often during distribution or profit-taking phases. Green CVD signals accumulation and buying pressure, while red CVD indicates distribution and selling pressure.
The current green phase is particularly meaningful because it's emerging while the spot price remains relatively flat. This disconnect between rising buy pressure and stagnant prices often appears during quiet institutional accumulation before broader market participants catch on.
Looking at the chart, XRP has been trading sideways between $2.2 and $2.8 since late summer 2025, following a pullback from highs above $3.2. The new CVD momentum suggests this downtrend may be exhausting itself as buyers gradually absorb available supply.
From a technical perspective, the support zone sits between $2.20 and $2.40, which aligns with historical accumulation levels. Resistance appears around $2.80 to $3.00, marking the upper boundary of this consolidation range. The CVD divergence shows higher buy activity despite sideways price action, creating a bullish divergence pattern. This setup mirrors what we saw in April when quiet accumulation preceded XRP's breakout to new highs.
 Peter Smith


