 Usman Salis
⬤ The spotlight has shifted to XRP's 3-day RSI, which is now moving closer to the oversold threshold. The chart shows XRP trading near $1.90 after a steady decline from the recent $3.38 peak, while momentum indicators continue to soften. The RSI is approaching a zone that has repeatedly marked absolute bottoms over the past four years.
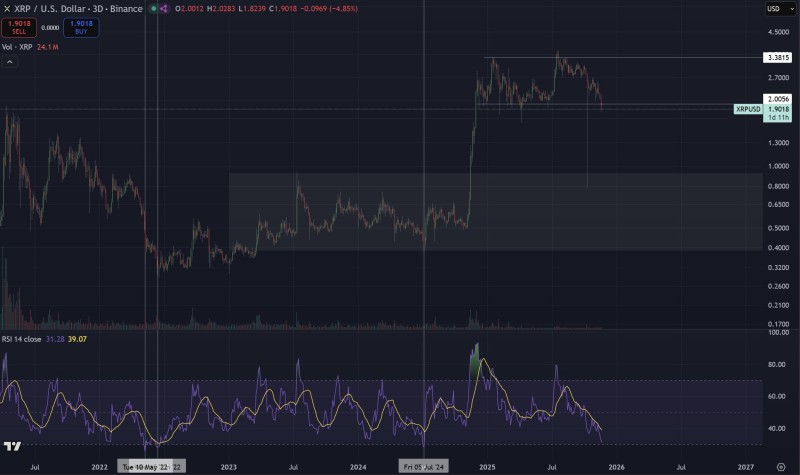
⬤ The chart shows a significant momentum loss following XRP's strong breakout in 2025, when the asset surged from a multi-year consolidation range into the $3.00 area. The pullback that followed has pushed XRP back toward a previous structural region. The 3-day RSI, shown with its smoothing line, keeps drifting lower and is nearing the same oversold area that came before major reversals in past cycles. Each touch of this zone in the last four years lined up with a decisive market bottom.
⬤ Market behavior on the chart highlights the shift from a sharp rally into a prolonged correction. Candle structure and moderate volume show continued pressure, while the declining RSI mirrors earlier cycle lows visible on the chart. These previous oversold readings aligned with strong rebounds, suggesting the current setup represents another important test of longer-term momentum conditions in XRPUSD.
⬤ This matters because prolonged declines in high-timeframe RSI often shape broader sentiment around major assets. When these signals converge with price retracements toward prior support zones, the market tends to reassess trend exhaustion and potential turning points. Whether XRP follows historical patterns or breaks from them could influence expectations across the broader digital asset space.
 Usman Salis


