 Eseandre Mordi

⬤ XRP just broke below its Gaussian Channel on the 3-day chart, marking what could be a significant shift in momentum. The Gaussian Channel tracks longer-term trends, and historically, losing this support has kicked off extended corrective periods. Looking at the pattern, previous breakdowns weren't quick dips—they turned into serious downtrends that lasted months.
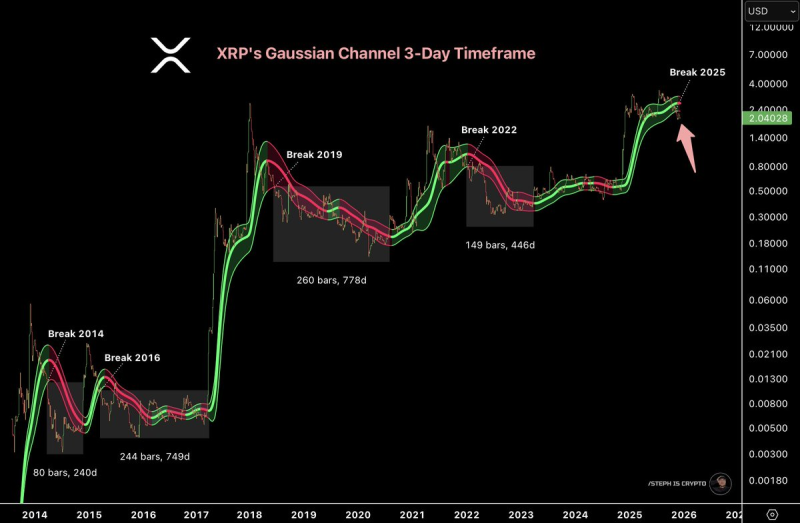
⬤ The chart shows this has happened before in 2014, 2016, 2019, and 2022. Each time XRP dropped below the channel, it entered a lengthy phase of consolidation and decline. We're talking anywhere from roughly 240 days to over 770 days of bearish price action before things finally stabilized. These weren't temporary pullbacks—they were structural shifts that took significant time to work through.
⬤ Right now, XRP is sitting below that same channel boundary again, putting it in familiar territory based on past cycles. During those earlier periods, price typically struggled to reclaim the channel for extended stretches. Real upward momentum only came back after long base-building phases had run their course. That's why this breakdown matters—it suggests we might be entering a corrective phase rather than just seeing a temporary technical blip.
⬤ This kind of higher-timeframe signal tends to shape market sentiment over months, not days. When a 3-day chart shows structural momentum shifting, it influences how traders and investors view the asset long-term. The key question now is whether XRP will stabilize quickly or follow those historical patterns of prolonged consolidation, which could have ripple effects across the broader crypto market.
 Eseandre Mordi


