 Saad Ullah

⬤ XRP has broken through the October 10 wick low, a level that held firm during several previous pullbacks. This shift suggests the short-term structure may be changing, with price now testing a support zone that's been important for maintaining trend stability.
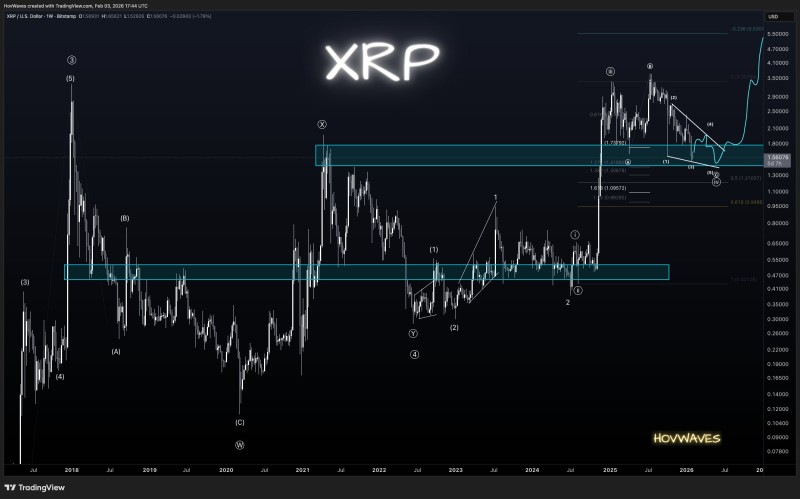
⬤ Looking at the weekly chart, this support area has been a major structural level that XRP has defended multiple times across different market cycles. After the recent drop, price has steadied within this zone instead of continuing lower, which suggests selling pressure might be easing. The technical pattern being watched is an ending diagonal within the C wave of an expanded flat—a formation that typically shows up in the later stages of corrective moves.
⬤ The key level to watch is $1.43 on higher timeframe closes. This price point lines up with important Fibonacci levels and previous consolidation areas visible on the chart. If XRP closes below $1.43 on a sustained basis, it would break the current structure and open the door for further downside. But as long as it holds above this threshold, the broader technical setup remains valid.
⬤ What happens at this support zone will likely decide whether XRP moves into a recovery phase or drops into a deeper correction. With long-term structure and short-term price action both converging at the same level, the next few higher timeframe closes could be decisive for momentum and overall market sentiment around XRP.
 Saad Ullah


