Peter Smith

XRP is entering a decisive phase where structure matters more than speculation. As Maxi points to an imminent historic breakout, the chart itself shows a different reality: a market still trapped inside a broader downtrend, now compressing toward a potential inflection point where the next move could be significant in either direction.
The XRP Downtrend Still Controls the Narrative
The weekly chart clearly shows XRP in a sustained decline from its highs near the $3.00 region. Price has consistently printed lower highs, with a descending trendline acting as firm resistance throughout the move. Every rally attempt has been capped beneath this falling resistance, reinforcing bearish control over the higher timeframe.
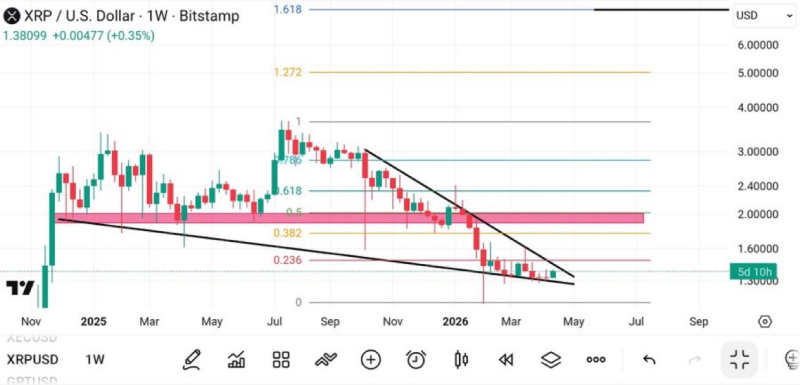
At the same time, price is no longer accelerating downward. Instead, it has begun to stabilize near the lower boundary of the range - signaling a shift from trend to compression that changes the character of the setup without yet confirming a reversal.
XRP descending channel keeps price under pressure as long as the trendline from late 2025 continues to cap every rally attempt - and the chart shows that cap remains in place at the current compression point.
A XRP Wedge Structure Tightens the Range
The most important feature on the chart is the narrowing price action. XRP is trading between a descending resistance line from late 2025 and a rising support line formed in early 2026, with Fibonacci levels marking key reaction zones - the 0.236 near current price and the 0.5 level around $2.00.
This creates a wedge-like structure where volatility is shrinking. Patterns like this often precede large moves - but they do not predict direction on their own. Notably, price remains below the $2.00 region, which continues to act as overhead resistance rather than reclaimed support.
XRP falling wedge signals potential breakout - but the key word is potential. The wedge is forming, the compression is real, and the expansion phase is likely approaching. What remains unresolved is whether that expansion is up or down.
Why the Current XRP Zone Matters Most
The lower boundary near $1.30-$1.40 has become a key holding area. Price has repeatedly tested this zone without breaking decisively lower - suggesting demand is present, but not yet strong enough to reverse the trend. The descending resistance simultaneously presses price downward, creating a compression point where both buyers and sellers are losing momentum.
The chart does not confirm extreme upside projections. There is no breakout yet, and price remains below major resistance zones. Instead, the structure clearly shows a market approaching a decision point:
- A break above the descending trendline would signal the first structural shift
- A reclaim of the $2.00 region would strengthen bullish momentum
- Failure to hold lower support could reopen downside pressure
XRP compression pattern points to volatility expansion as the wedge continues to tighten - and the longer the compression holds, the more decisive the eventual resolution tends to be. For now, the next move will likely define XRP's trend for weeks to come.
 Peter Smith