 Usman Salis
XRP has entered a critical phase. After weeks of narrowing price action, the asset is trapped in a symmetrical triangle—a pattern that technical traders know often precedes big volatility. Currently trading around $2.43 on the 3-day chart, XRP is sitting just above key support, caught between rising lows and falling highs that are squeezing tighter by the day.
What the Chart Shows
As analyst STEPH IS CRYPTO points out, this looks like the classic "calm before the storm" setup. The question isn't if XRP will make a big move, but when—and in which direction.
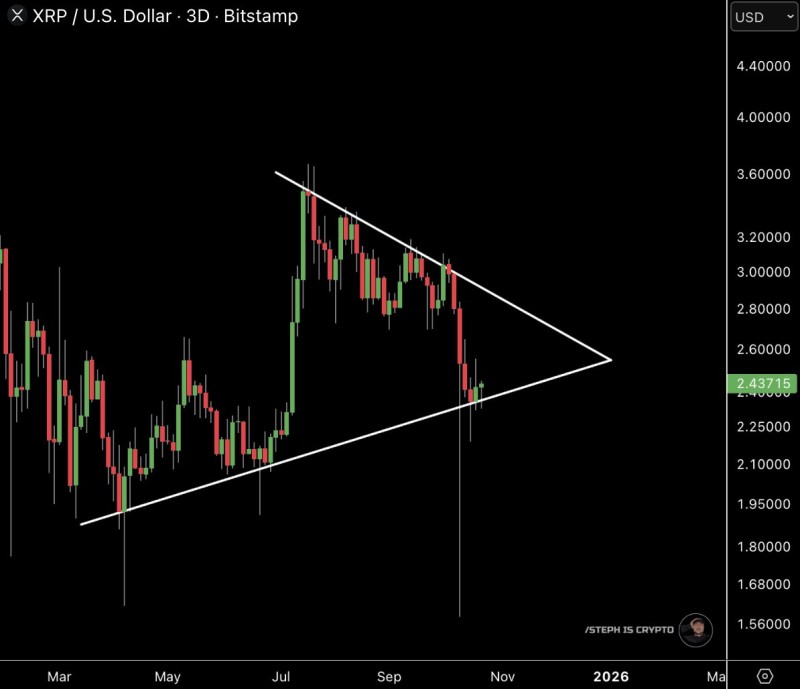
The 3-day XRP/USD chart from Bitstamp displays a textbook symmetrical triangle that's been forming since March 2025. Price is currently at $2.437, wedged between a descending resistance line coming down from around $3.20 and an ascending support line rising from roughly $1.80. The triangle's apex is approaching fast, likely to resolve by late October or early November. The breakout zone sits between $2.25 and $2.80—whichever level gives way first will likely determine XRP's direction for the coming weeks or even months.
These compression patterns don't happen in a vacuum. When volatility contracts this tightly, something has to give. A confirmed break above $2.80 could open the door to $3.50–$4.00, while a drop below $2.25 might send XRP back down to test the $2.00–$1.85 zone.
What's Driving This Setup
Several factors are converging to make this moment particularly significant. Ripple continues expanding its network of global payment partners, which strengthens long-term confidence in XRP's utility. Meanwhile, macro conditions are shifting—inflation is stabilizing and the U.S. dollar index has been cooling, giving risk assets like crypto more room to breathe. And it's not just XRP. Similar triangle patterns are showing up across major altcoins, suggesting the entire crypto market may be gearing up for its next big move.
XRP has a track record with these triangle patterns. In 2017, 2020, and 2023, the asset formed similar compression structures before breaking out into significant rallies. Each time, price traded in increasingly tight ranges before exploding upward. That history doesn't guarantee another bull run, but it does suggest these patterns are worth taking seriously.
Still, compression doesn't predict direction—it just signals that volatility is coming. The real confirmation will come when XRP either holds above $2.80 or fails to defend $2.25.
XRP is at the edge of a breakout. The symmetrical triangle reflects an increasingly even battle between buyers and sellers, but these standoffs rarely last long. If bulls push through $2.80 with conviction, we could see a run toward $3.50–$4.00 and the start of a fresh rally phase. If support at $2.25 cracks, expect more sideways action or even a dip back toward $2.00.
 Usman Salis


