 Usman Salis
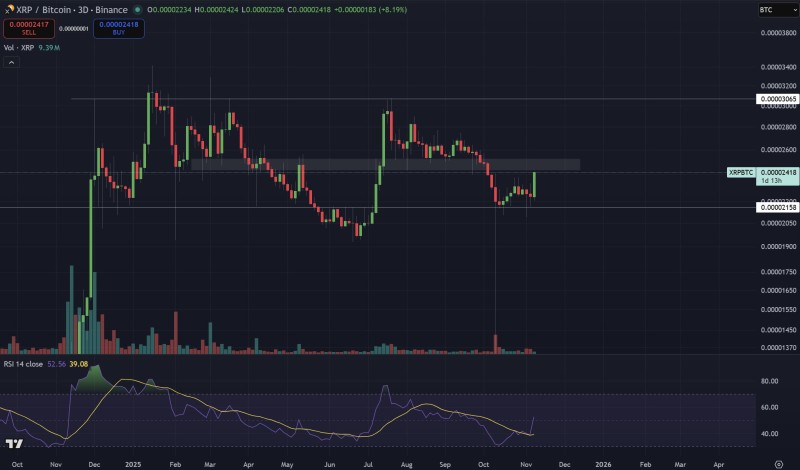
⬤ XRP is now testing its first major resistance area against both Ethereum and Bitcoin. The asset has reached the 0.00071 level versus ETH while simultaneously touching the midpoint of its year-long range against BTC. Charts show XRP pushing into these horizontal resistance zones—areas that have previously capped upward moves.
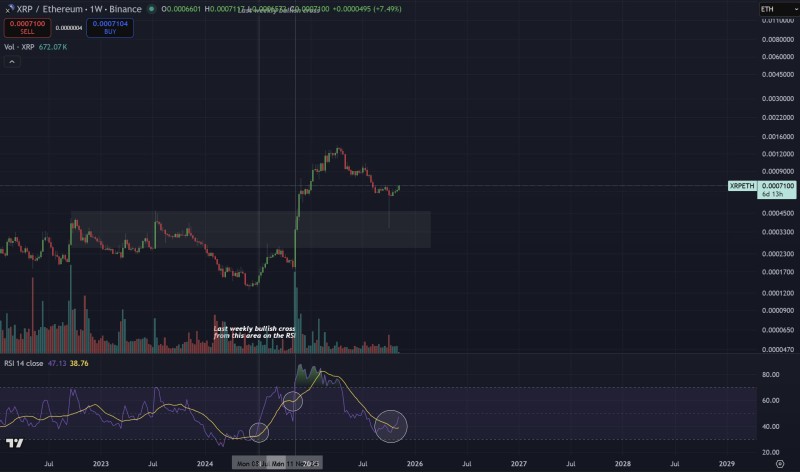
⬤ On the XRP/ETH pair, the 0.00071 level has been a tough spot to crack through historically. Against BTC, XRP is moving back into the middle of a long consolidation range. Both charts show XRP rising toward resistance clusters that have rejected price before.
⬤ These resistance levels matter because they've historically triggered pauses or reversals in XRP's performance relative to ETH and BTC. When an asset hits major resistance on multiple pairs at once, traders often see it as a potential turning point for momentum.
⬤ For investors, this setup is worth watching. A clean break above both resistance zones could signal a stronger trend for XRP going forward. But another rejection might mean continued underperformance versus the two biggest cryptocurrencies. With XRP pressing right up against these levels, the market is watching to see which way it breaks.
 Usman Salis


