 Peter Smith

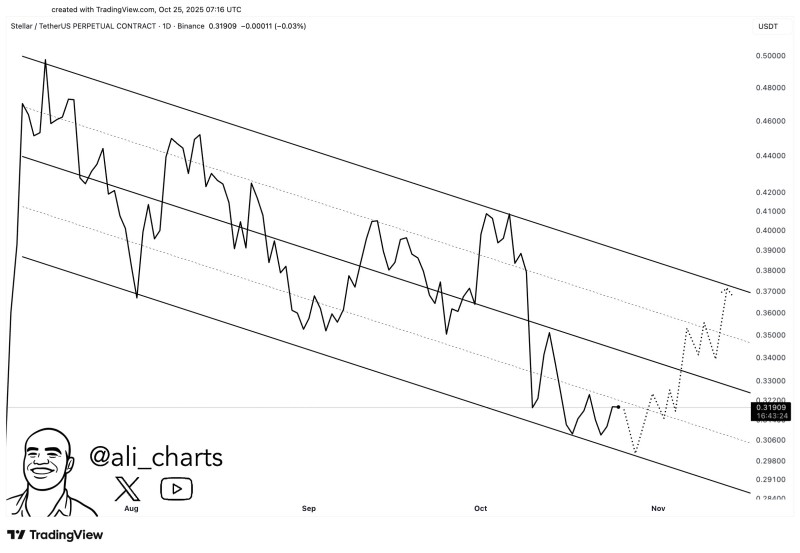
After sliding steadily for weeks, Stellar (XLM) might be gearing up for a comeback. Recently pointed out that buying around $0.30 could be a smart entry point, with the token potentially climbing toward $0.37. The chart backs this up, showing XLM respecting a long-term downward channel while momentum starts building toward the upper range.
Chart Setup
The daily XLM/USDT chart shows Stellar bouncing around inside a well-defined descending channel for months now. Every time price hits the bottom line, we see temporary bounces. The top line? That's been a tough ceiling to break through.
Right now, XLM is trading near $0.319, just above that crucial $0.30 support zone that's held strong since early August. This is what Ali calls a "buy-the-dip" level—where previous reversals have kicked off short-term rallies. The projected path on the chart points toward $0.37, lining up with both the middle and upper boundaries of the channel.
Key Levels to Watch
- Major Support ($0.30–$0.31): This channel floor has repeatedly attracted buyers and sparked recoveries.
- Mid-Channel Resistance ($0.34–$0.35): A short-term barrier where some traders might take profits before any further climb.
- Upper Target ($0.37–$0.38): The channel's upper boundary, likely marking the short-term peak of this recovery if it plays out.
If price holds above $0.30, the setup suggests a potential 15–20% gain, similar to past bounces from this zone. But if XLM closes decisively below $0.30, the bullish case falls apart and we could see a drop toward $0.28.
Stellar's fundamentals add some weight to this technical picture. The network keeps expanding its presence in blockchain remittances and cross-border payments. The Stellar Development Foundation has recently rolled out new integrations with fintech partners and stablecoin projects. Plus, as Bitcoin holds above key support levels, we often see money rotate into mid-cap altcoins like XLM, which can fuel these short-term recoveries.
 Peter Smith


