 Saad Ullah

⬤Stellar is pressing against a critical technical level as price hits the lower boundary of a long-term ascending channel for the second time. This marks the same channel structure seen in 2017, when XLM touched the lower trendline twice before launching into a major expansion phase. The current setup shows price compressing near this support after a drawn-out period of consolidation and selling pressure, pointing to a reaction zone worth watching closely.
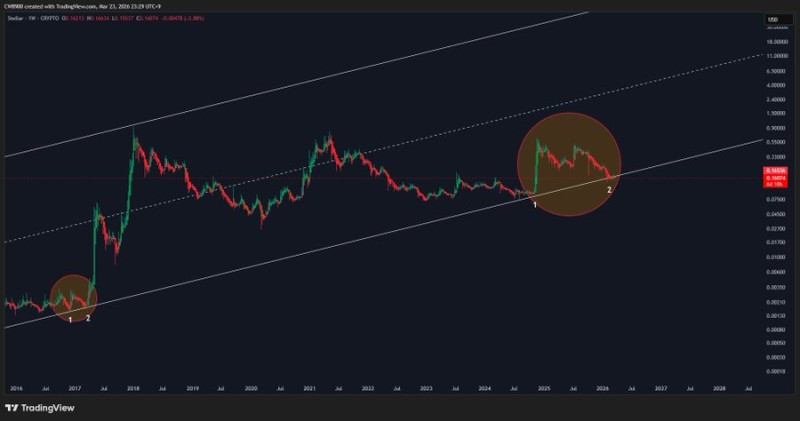
⬤The broader XLM structure has tracked within a multi-year rising channel, with recurring pullbacks to the lower boundary. What makes the current pattern stand out is how closely it mirrors that 2017 cycle. Both instances involved a double-touch of the lower trendline before a sharp recovery followed. Recent price behavior has reinforced this pattern, including the setup covered in XLM price analysis: Stellar targets $0.34 rebound after stabilizing near $0.25, where stabilization at support preceded a push higher.
⬤From a technical standpoint, repeated tests of lower channel boundaries tend to mark key inflection points. XLM is consolidating near support while holding the broader ascending structure intact. In 2017, a similar configuration was followed by a significant rally -- and that historical comparison is driving the current bullish read. This echoes what was observed in Stellar XLM price prediction: breakout could signal a 100% rally, where breakouts followed extended consolidation phases before meaningful moves higher.
⬤XLM is now sitting at one of the more technically significant levels in its long-term chart. The repeated interaction with this support zone defines where the next directional move will likely originate. Whether price holds and builds or breaks and backtracks, this channel boundary is the line in the sand. The pattern closely follows the consolidation-before-expansion playbook that has appeared across multiple XLM cycles, making the current zone a focal point for both short and long-term positioning.
 Saad Ullah


