 Victoria Bazir
⬤ Solana is sitting at a technically critical spot on the weekly chart right now, with the price resting directly on a long-term ascending trendline. This trendline has been the backbone of SOL's structure from late 2023 all the way through 2025, basically acting as the foundation for higher lows during the entire recovery phase. Right now, SOL is trading around $130, and that's exactly where this structural support is being tested.
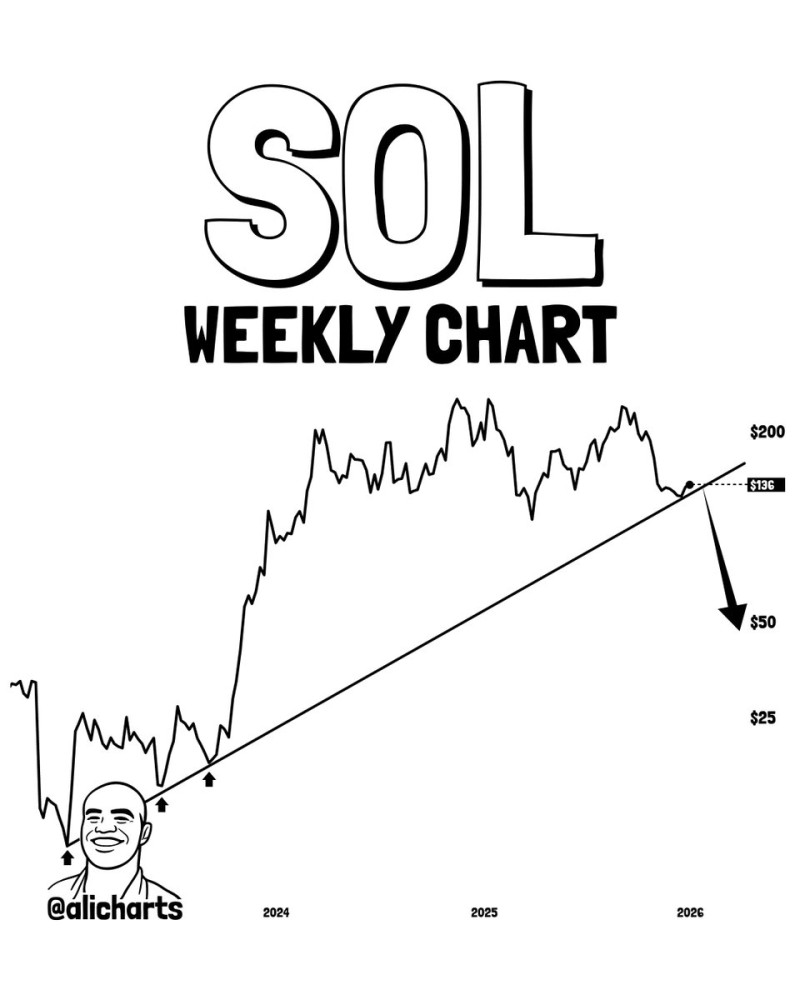
⬤ The trendline has been absolutely crucial for Solana's long-term setup. The chart shows multiple moments where price bounced hard after hitting this rising support—especially during the early 2023 recovery and throughout the pullbacks in 2024. These reactions kept the broader uptrend alive even when volatility ramped up and price started forming those higher swing patterns.
⬤ Here's the thing though—recent price action shows Solana losing steam as it consolidates right along this same trendline. The chart lays out a scenario where if SOL breaks below this support and doesn't reclaim it, we could be looking at significantly lower levels. There's even a projection showing a potential drop toward the $50 zone. Now, that's obviously a hypothetical path, but it really highlights just how important this current level is in determining whether the long-term structure holds or if we're heading into a deeper correction.
⬤ This setup matters way beyond just Solana. SOL is a major large-cap asset, and its price structure often reflects what's happening across the entire altcoin market. Long-term trendlines on weekly charts like this one? They're basically the line in the sand between trend continuation and a full structural reset. How Solana performs at this level could shape expectations for volatility, downside risk, and overall market confidence across alts as we move into the next phase of this cycle.
 Victoria Bazir


