 Marina Lyubimova

⬤ Solana's price has shifted into correction mode, showing what looks like the beginning of a B-wave pullback. Trading in the mid-$130s after its recent rally stalled, SOL is now testing the $134.22 to $137.11 range that's become the key micro support area for this developing wave.
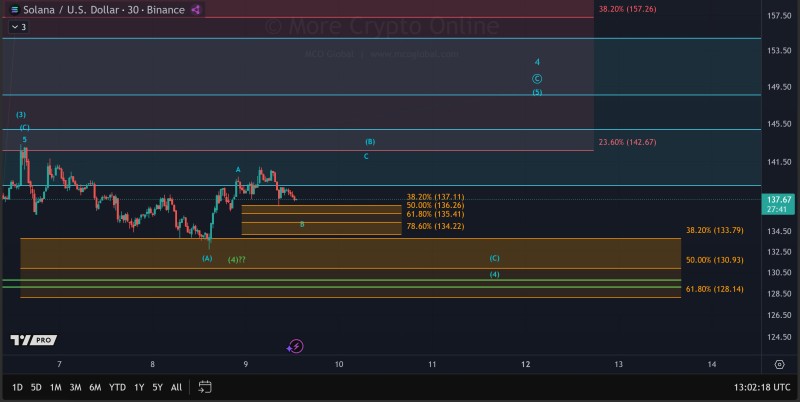
⬤ The chart shows a bigger corrective pattern taking shape after the previous upward push. Solana's dropping into a well-defined Fibonacci support cluster where multiple retracement levels line up. This zone matches up with previous price reactions, making it technically significant. As price moves closer to this area, the downward pressure has eased off, which suggests this pullback is happening in an orderly way rather than accelerating into a sharper drop.
⬤ Looking at the wave structure, this current move is being read as a B-wave correction, not a full trend reversal. Price is still holding above the lower edge of that support zone, which keeps the corrective scenario valid. The chart also shows that buyers stepped in around these levels before, and if price holds steady within this zone, it backs up the corrective interpretation. A break below would challenge the current wave count.
⬤ This matters for the broader market because Solana's a heavyweight in the altcoin space and often signals shifts in short-term momentum. Corrective pullbacks like B waves can influence sentiment across related assets, especially after strong moves. With Solana now interacting with this clearly marked support zone, traders are watching to see if the area stabilizes the price or if the correction pushes deeper, which will shape near-term volatility and trend direction.
 Marina Lyubimova


