Peter Smith

⬤ Solana's weekly chart reveals an extended consolidation phase followed by a sharp drop and subsequent recovery. SOL looks like it just completed its final dip before kicking off a new cycle.
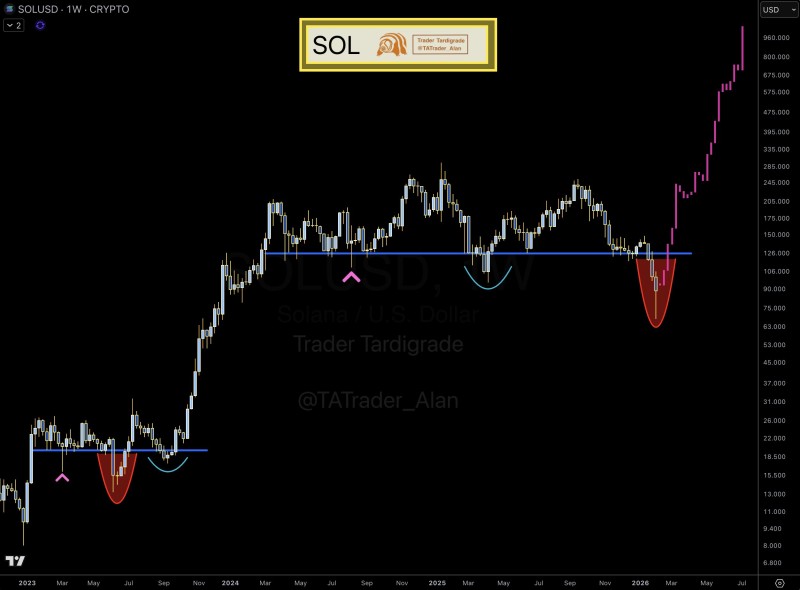
⬤ The chart highlights multiple consolidation zones clustered around a key horizontal support level. Price keeps bouncing back to this area before pushing higher, creating rounded bottom formations across various timeframes.
⬤ The latest pattern shows SOL taking a deep dive into the support zone, quickly followed by a powerful rally that broke above the consolidation range. This movement lines up perfectly with the cycle pattern mapped out on the chart.
⬤ The structure signals a shift from sideways consolidation into upward momentum within the current cycle phase.
 Peter Smith