 Usman Salis
⬤ Solana's rally has stalled and the token is now working through a corrective phase after what looks like a short-term peak. The 1-hour chart shows the upward momentum has faded and price is rotating down into a pullback. The key area everyone's watching now sits between $119.45 and $123.82 — a zone tied to what technical analysts call wave (B) support. Price is actively testing this range right now.
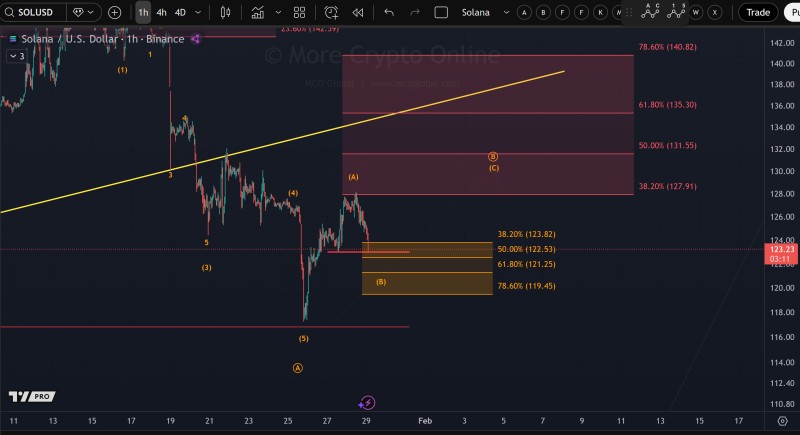
⬤ The chart layout follows an Elliott Wave correction pattern that kicked in after Solana dropped from recent highs. SOL was trading near $140 not long ago before sellers took control, which backs up the idea that a temporary top is already behind us. "The market is no longer extending higher and is instead rotating into a pullback phase," according to the analysis. Fibonacci retracement levels line up almost perfectly with this support zone — the 38.2%, 50%, and 61.8% levels all cluster within this range. Price action is hovering inside these boundaries, showing the market hasn't decided yet whether support will actually hold.
⬤ What happens next depends entirely on whether buyers can protect this wave (B) support area. If price stays above $119.45, the corrective structure remains intact and opens the door for a potential c-wave bounce higher in the next few sessions. But if this range breaks down, the technical setup weakens and the risk of a deeper drop increases. For now, Solana's structure still looks constructive as long as it holds within the highlighted support zone.
⬤ This pullback matters beyond just Solana itself. SOL often acts as a temperature check for how aggressive traders are feeling about higher-risk crypto assets. When you get well-defined corrections like this, it tends to shift positioning and momentum across the whole sector. Whether bulls can defend the $119.45 to $123.82 area will likely tell us if this decline is just a breather or the beginning of something more drawn out.
 Usman Salis


